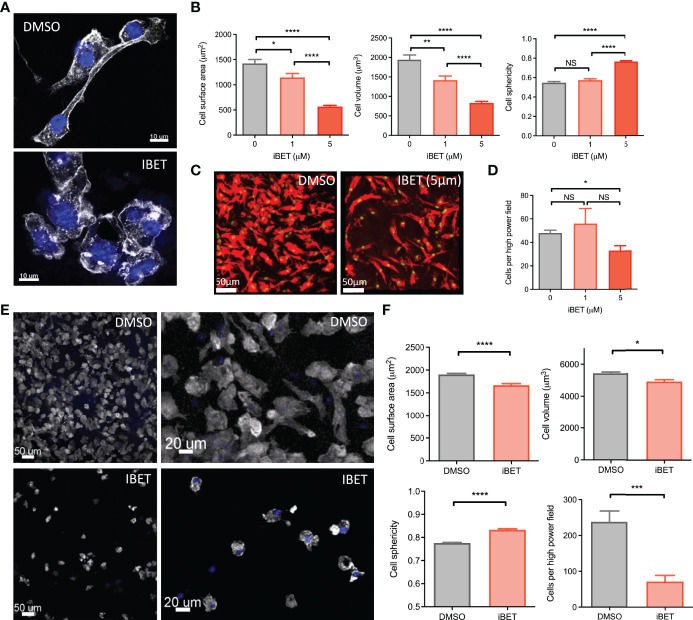
Figure 3.
iBET alters MNP morphology and adhesion. (A) Representative images showing effect of iBET treatment on murine BMDM morphology in vitro. DAPI stain shown in blue, phalloidin in white. (B) Quantification of BMDM morphology by confocal microscopy of murine BMDMs following treatment with iBET for 24 hours. (C) Representative image change in BMDM adhesion after iBET treatment in vitro; phalloidin (red), DAPI (green). (D) Cells per high powered field observed after iBET treatment. Means ± SEM shown for data representative of 5 high-powered fields per condition. Means ± SEM shown for data representative of 5 high-powered fields per condition (A–D). (E) Representative images showing effect of iBET treatment on murine BMDC morphology and adhesion in vitro. DAPI stain shown in blue, phalloidin in white. (F) Quantification of BMDC adhesion and morphology by confocal microscopy of murine BMDCs following treatment with iBET (3.3μM) for 24 hours. Means ± SEM shown for data representative of 10 high-powered fields per condition. Significance testing using two-tailed Student’s t-test (B, D, F).

