Figure 4.
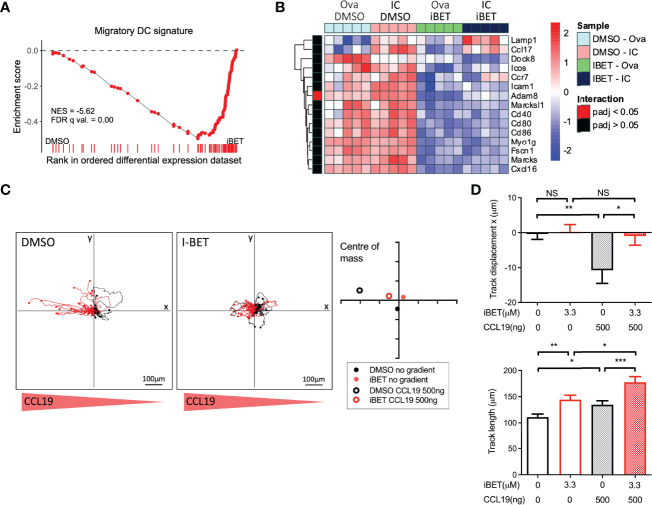
iBET limits DC migration in vitro. (A) GSEA of gene signature specific to migratory DCs, curated from scRNAseq data, in iBET treated murine BMDCs. Gene signature derived from Brown et al. (2019), GEO: GSE137710. (B) Heat map of expression of selected genes involved in DC migration and maturation. (C) Representative migration tracks of Ova-IC stimulated BMDCs over 2 hours, and average centre of mass in a 3D collagen matrix with or without a 500ng CCL-19 gradient. Red track marks represent cells with final displacement in the direction of the chemokine gradient. (D) Selected chemotaxis parameters from (C). Means ± SEM shown for data representative of 3 independent experiments, including at least 180 tracked BMDCs for each condition. RNA-seq data is representative of 5 biological replicates from independent mice. Significance testing using Student’s t-test.

