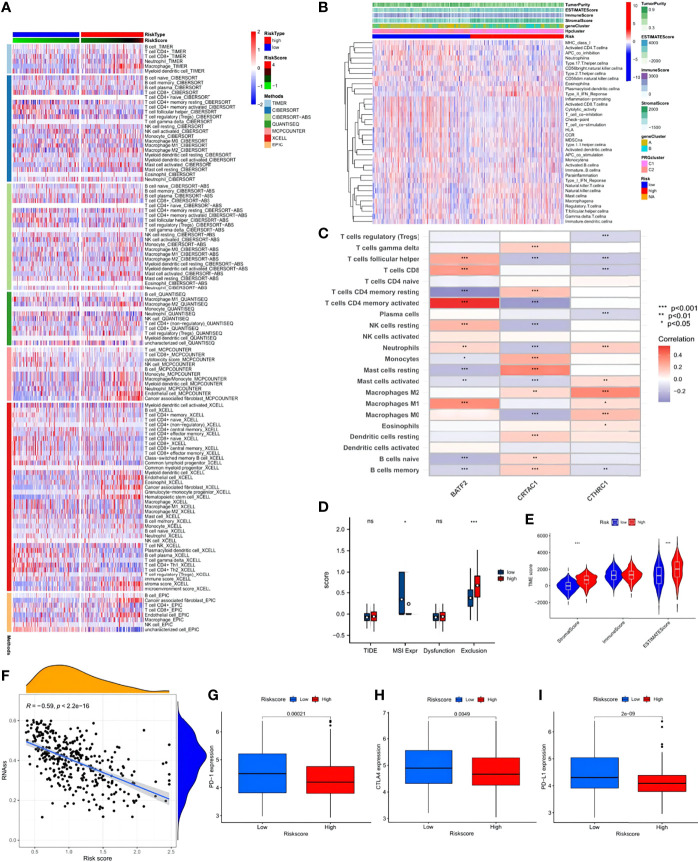
Figure 9.
Immune annotation and correlation between HP infection and anti-PD-1/L1, anti-CTLA-4 immunotherapy. (A) Immune cell-infiltrating characteristics of high- and low-risk groups and their correlation with risk signature. (B) Relations between tumor purity, ESTIMATE score, immune score, stromal score, and different STAD phenotypes. (C) Correlation between the abundance of immune cells and three candidate genes. (D) Box plot suggesting the difference of response towards immunotherapy between high- and low-risk score group. (E) Violin plot illustrating the result of ESTIMATE analysis. (F) Relationships between the risk signature and cancer stem cell (CSC) index. (G–I) Expression of PD-1, CTLA-4, PD-L1 in low- and high-risk score groups, respectively. ns, no significance, p≥0.05; *, p< 0.05; **, p<0.01; ***, p<0.001.

