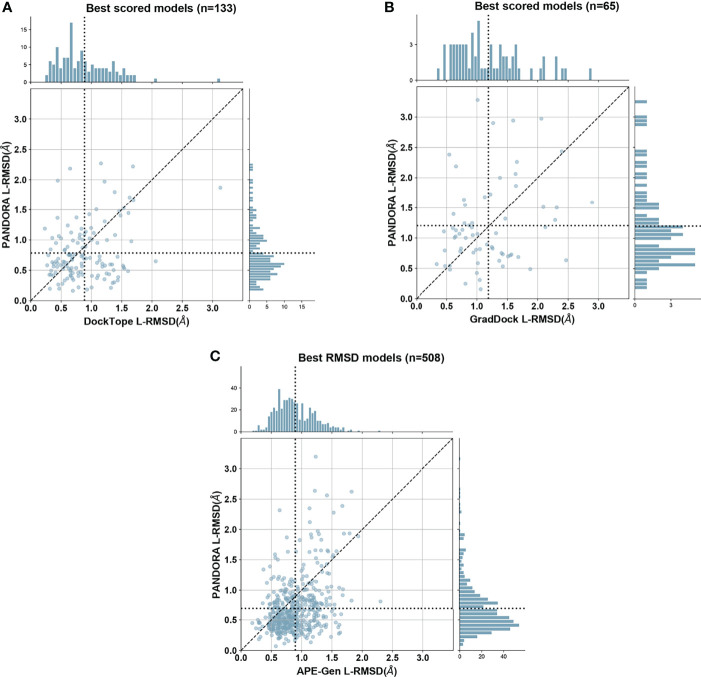
Figure 3.
PANDORA comparison with the state-of-the-art methods. Y axes represent PANDORA L-RMSD per case while X axes represent the L-RMSD of the same case modelled with the reported method. The dotted line indicates the average L-RMSD for each method. (A) Difference between PANDORA best molpdf model Cα L-RMSD and DockTope reported Cα L-RMSD on 133 cases (PANDORA cross-docking against DockTope cross-docking); (B) Difference between PANDORA best molpdf model backbone + Cβ L-RMSD and GradDock reported backbone + Cβ L-RMSD on 65 cases (PANDORA cross-docking against GradDock cross-docking); (C) Difference between PANDORA best L-RMSD model Cα L-RMSD and APE-Gen reported Cα L-RMSD on 509 cases (PANDORA cross-docking against APE-Gen self-docking).

