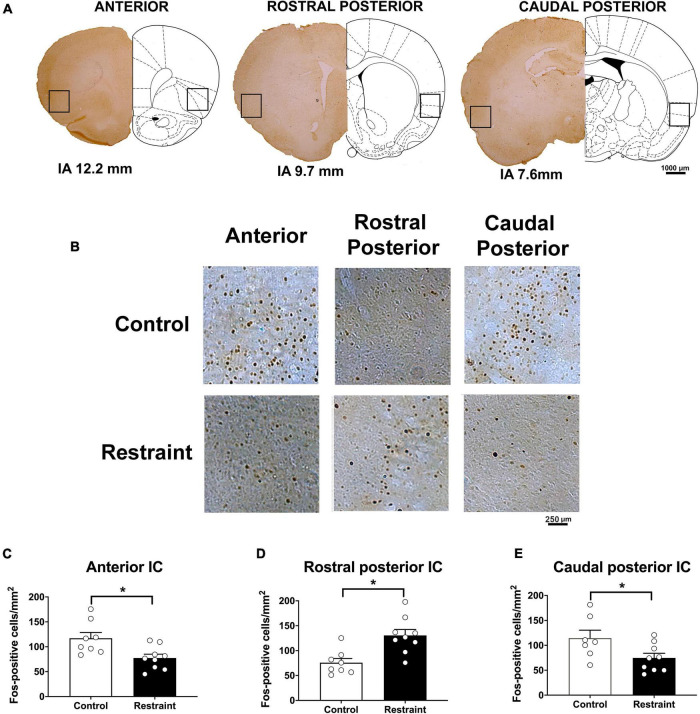
FIGURE 2.
Effect of restraint stress on the number of Fos-positive cells along the rostrocaudal axis of the insular cortex (IC) (A). Representative coronal sections indicating the IC locations where the Fos-positive cells were quantified (B). Representative coronal sections showing Fos-positive cells of representative animals in the anterior (left), rostral posterior (middle), and caudal posterior (right) subregions of the IC in control animals (top) and rats subjected to an acute 60-min session of restraint stress (bottom). (C–E) Number of Fos-positive cells in the anterior (C), rostral posterior (D), and caudal posterior (E) regions of the IC in control animals (white bars, n = 8) and rats subjected to an acute 60-min session of restraint stress (black bars, n = 9). The bars represent the mean ± SEM. *p < 0.05, Student’s t-test.

