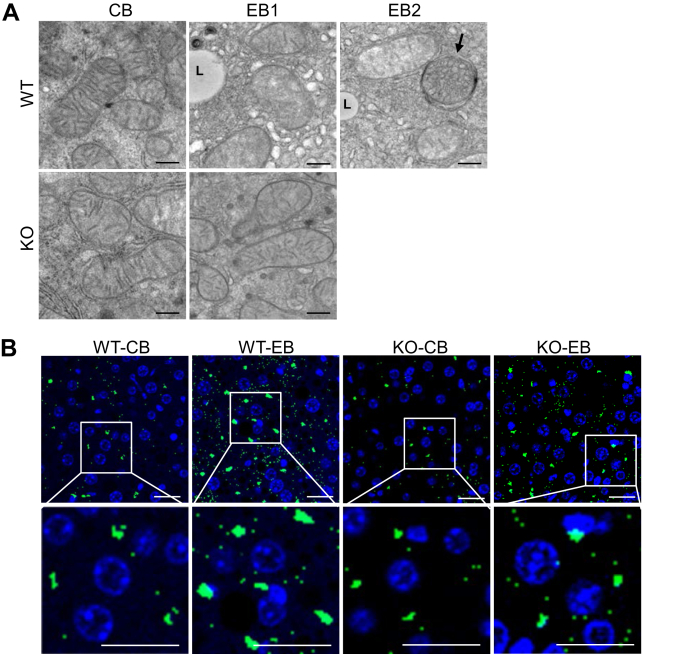
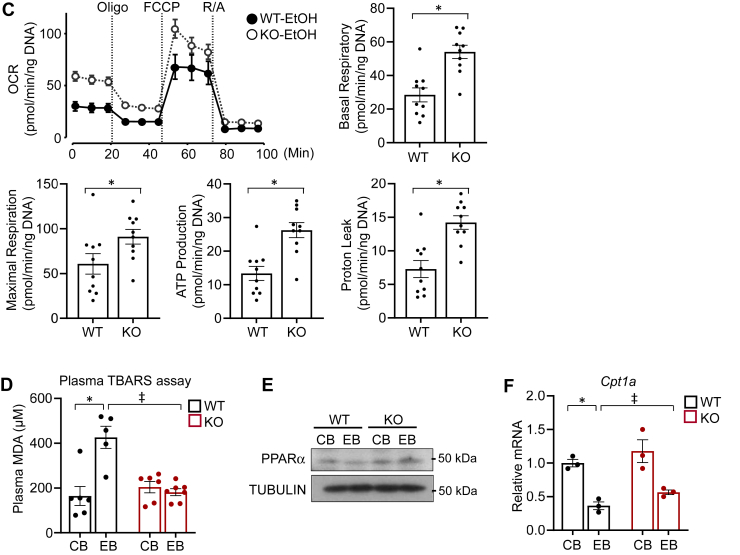
Figure 7.
miR141/200c deficiency improves ethanol-induced mitochondrial dysfunction.A, representative images of TEM of liver sections from WT- and KO-fed CB or EB. Images were acquired at x23,000 magnification. The scale bar represents 500 nm. B, representative images of LC3 immunofluorescence of liver sections from WT- and KO-fed CB or EB. Images were acquired at the 40× oil immersion objective. The scale bar represents 50 μm. C, OCR of primary hepatocytes prepared from WT- and KO-fed LDC supplemented with ethanol for 1 month was analyzed by Seahorse FX24 analyzer under basal conditions or in response to indicated inhibitors. D, a plasma TBARS assay is shown. E, Western blot of protein pooled from WT- and KO-fed CB or EB (n=6–8). F, mRNA expression levels of genes were measured by qPCR in mouse livers and normalized to Rpl32 or Hprt (n=6–8). Data are presented as mean ± SEM. Statistical significance was assessed by Student’s t test; ∗p < 0.05 (C). ∗p < 0.05 WT-CB versus WT-EB (D and F); ǂ, p < 0.05, WT-EB versus KO-EB (D and F). The arrow in (A) indicates an autophagosome. L, lipid droplet; OCR, oxygen consumption rate; Oligo, oligomycin; FCCP, Carbonyl cyanide-4 (trifluoromethoxy) phenylhydrazone; R/A, rotenone and antimycin A. CB, LDC without ethanol supplementation plus maltose dextrin binge; EB, LDC supplemented with ethanol plus ethanol binge; LDC, Lieber-DeCarli liquid diet; OCR, oxygen consumption rate; TBARS, thiobarbituric acid reactive substances; TEM, transmission electron microscopy; LC3, microtubule-associated protein 1 light chain 3.


