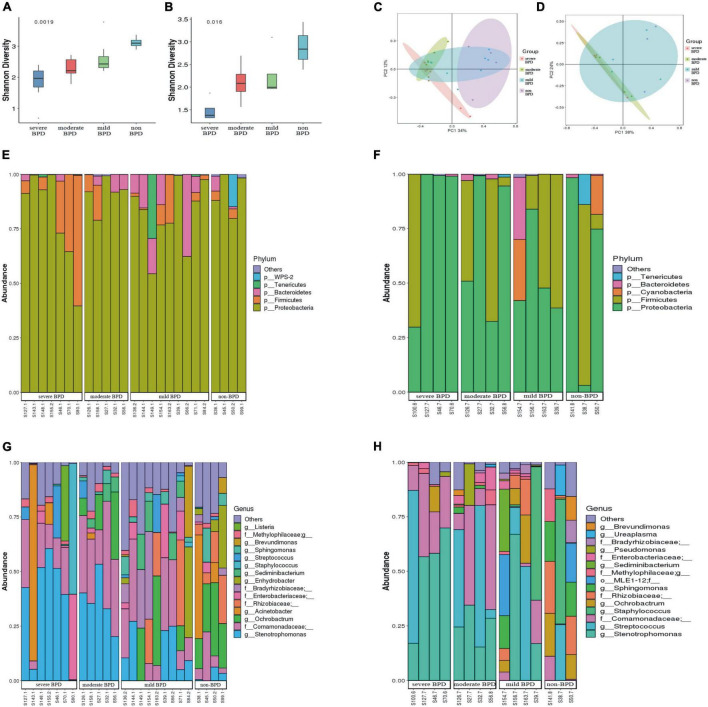
FIGURE 1.
Diversity and composition of the airway microbiome. (A) Shannon index at birth (Day 1); (B) Shannon index on Day 7 after birth (a greater Shannon index is indicative of higher microbial diversity); (C) Principal coordinate analysis (PCoA) of microbial communities at birth (Day 1); (D) PCoA of microbial communities on Day 7 after birth (samples near to each other have similar microbial composition, while samples far from each other have distinct microbial composition); (E,F) Relative abundance of bacterial phyla (E stands for day 1 after birth, F stands for day 7 after birth). (G,H) Relative abundance of bacterial genera (G stands for day 1 after birth, H stands for day 7 after birth). (On day 1, the number of infants with severe BPD, moderate BPD, mild BPD and non-BPD was 7, 5, 9, and 4, respectively. On day 7, the number of babies was 4, 4, 4, and 3, respectively. On day 7, some specimens were missing).

