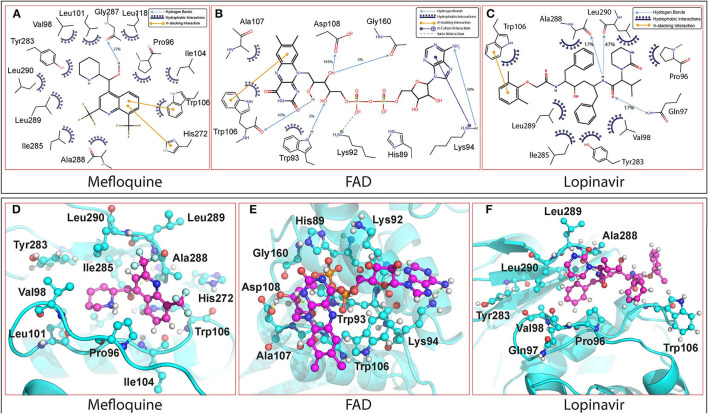
Figure 3.
The interactions of the molecules with PLpro observed throughout the 100 ns simulations are depicted. The interactions were estimated by geometric criteria and visual inspection. (I) 2-D Interaction diagram of (A) Mefloquine, (B) FAD, and (C) Lopinavir with PLpro of SARS-CoV-2. (II) 3D-binding pose of (D) Mefloquine, (E) FAD, and (F) Lopinavir with PLpro of SARS-CoV-2.

