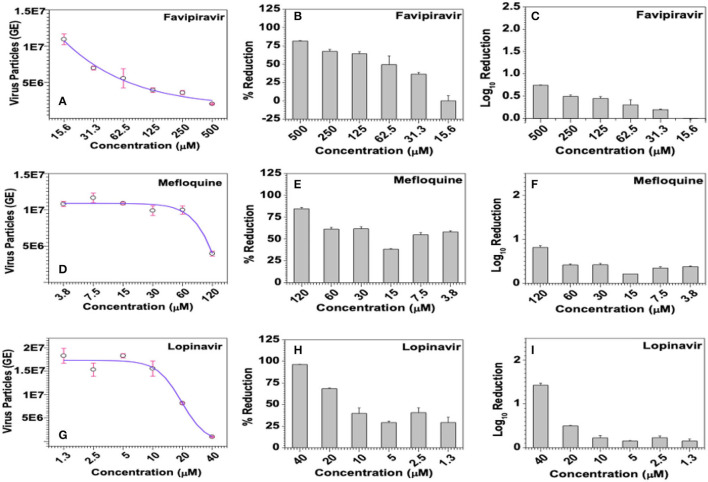
Figure 9.
Effect of the selected compounds on virus titers. (A–C) Favipiravir, (D–F) Mefloquine, and (G–I) Lopinavir were incubated with HCoV-229E-infected (@1.0 MOI) MRC-5 cells at the indicated concentrations for 6 days, virus-infected culture supernatants from triplicate wells were individually processed to extract viral genomic RNAs and quantified by SYBR Green-based qPCR using primer pair targeting a 70-base region in the cDNA coding for the viral membrane protein. Ten-fold serial dilutions of the recombinant plasmid carrying the target 70-base region were used to generate the standard curve, titers of virus particles (A,D,G), represented as genome equivalents (GE), were derived from the standard curve as detailed in methods and the data was used to calculate % inhibition (B,E,H), and log10 inhibition (C,F,I) in viral titers.

