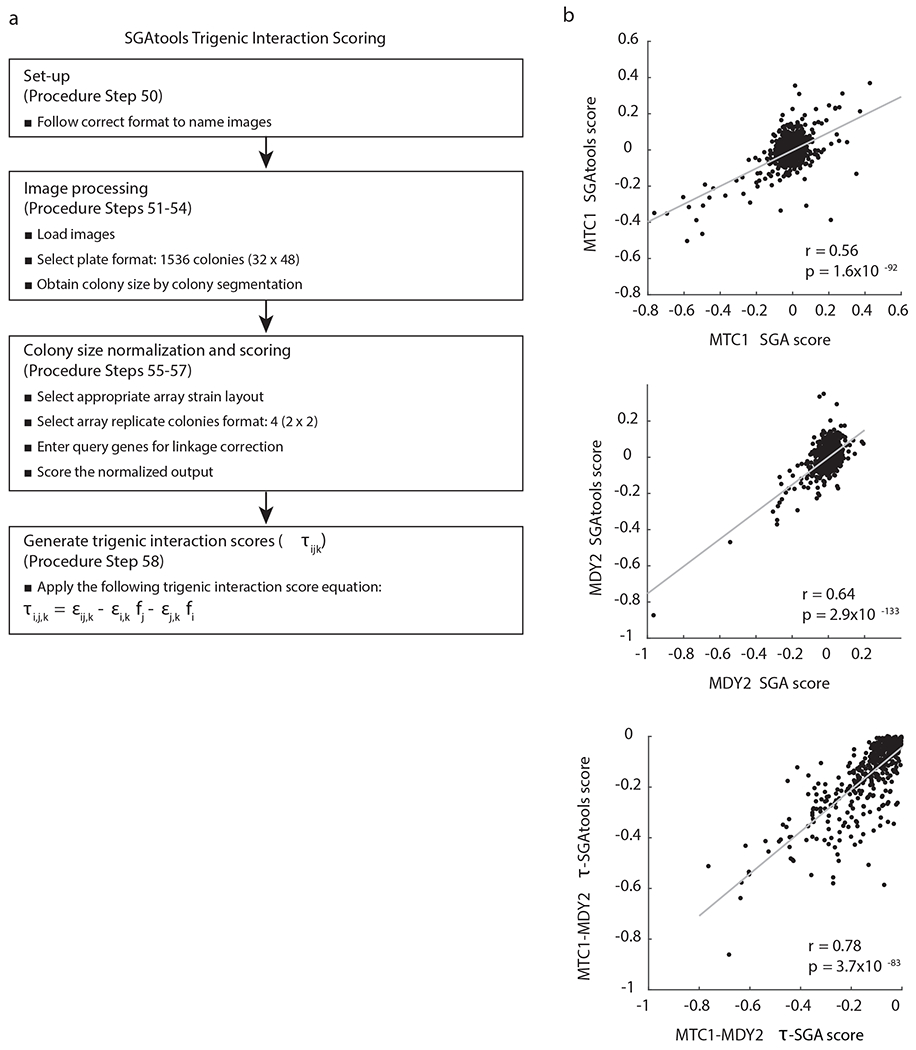
Fig. 7 |. Schematic of the steps for processing and scoring small-scale trigenic interaction screens using SGAtools platform.

a, Files are named using the appropriate format, followed by image processing to segment colonies and obtain normalized colony sizes, which are then scored for trigenic interactions by applying the trigenic interaction score equation. It should be noted that the equation for scoring trigenic interactions slightly differs from Fig. 1, and the former can be directly derived from the latter as shown previously9. b, Scatter plot comparing digenic and trigenic interactions scores derived from SGAtools and a previous study11 for the following query strains: mtc1Δ, mdy2Δ and mtc1Δ mdy2Δ. r denotes the Pearson correlation coefficient.
