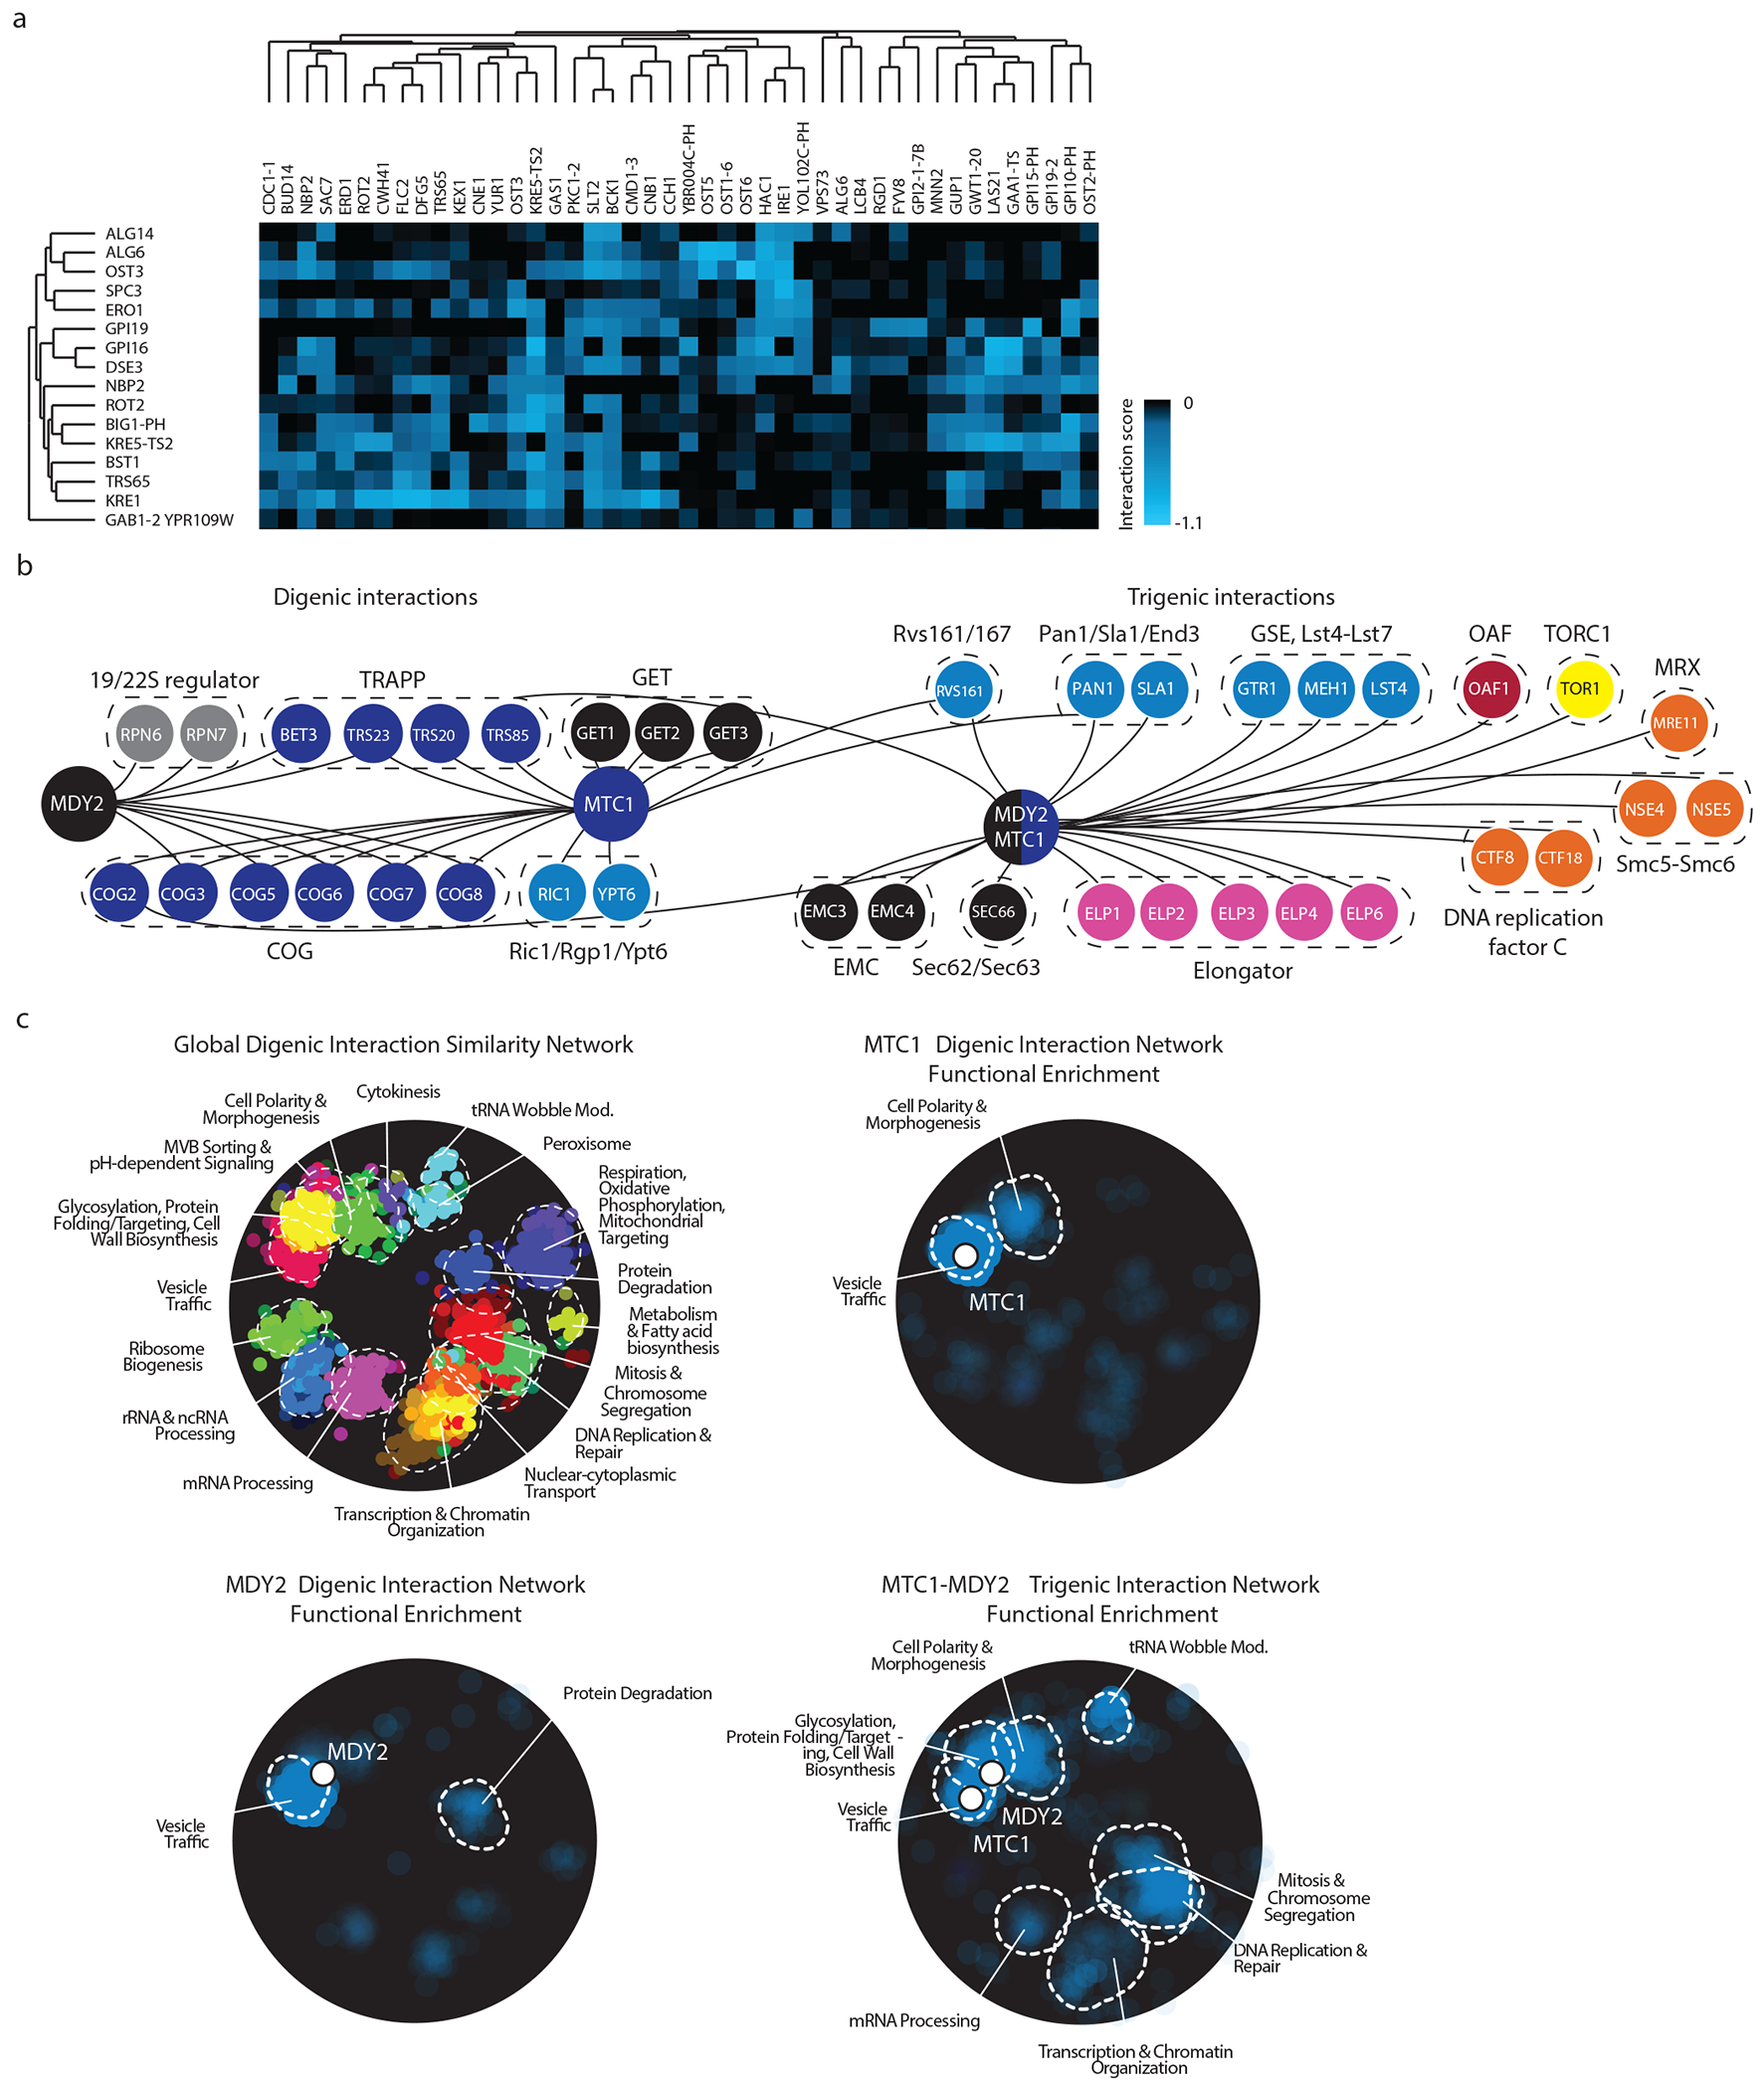
Fig. 8 |. Representative examples of clustering and visualization of τ-SGA scores.

a, A sample visualization of the .cdt file generated from the output of sample data as described in steps 44 - 50. Genes associated with query strains are on the y-axis and array strains are on the x-axis. b, Representative digenic and trigenic interactions for the single mutant query strains MDY2, MTC1 and their corresponding double mutant query strain MDY2-MTC1 as visualized by Cytoscape and overlapped with representative protein complexes. c, Enrichment of digenic and trigenic interactions within the global digenic interaction profile similarity network annotated by SAFE bioprocess terms. Panels b and c have been adapted from a previous study11.
