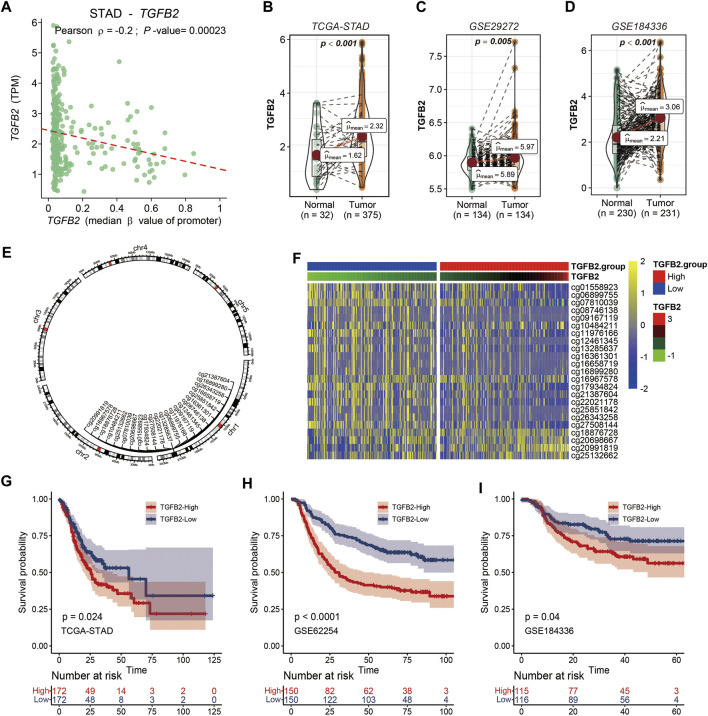
FIGURE 1.
TGFβ2 and TGFβ2 Methylation. (A) Relationship between TGFβ2 and TGFβ2 methylation promoter region. (B–D) TGFβ2 expression in gastric cancer tissues and normal tissues in STAD, GSE29272 and GSE184336 (HMUCH). (E) Location of the TGFβ2 methylation site on the chromosome. (F) Heatmap of TGFβ2 and TGFβ2 methylation expression. Kaplan-Meier survival analysis of TGFβ2 in STAD (G), GSE62254 (H) and GSE184336 (I).

