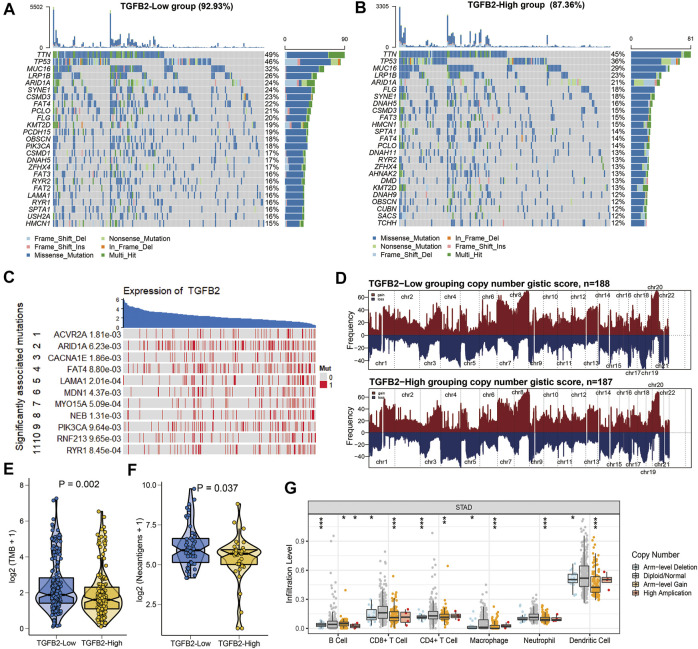
FIGURE 7.
TGFβ2 and mutations. (A, B) Waterfall plot of the 25 genes with the highest mutation frequencies in different TGFβ2 groups. (C) Mutations in genes affecting TGFβ2 expression. (D) Comparison of the frequency of copy number changes in different TGFβ2 groupings. Chromosomal locations of peaks of significantly recurring focal amplification (red) and deletions (blue) were presented. Comparison of TMB (E) and neoantigens (F) between different TGFβ2 groups. (G) Effect of the Genetic Alterations of TGFβ2 on the Immune Cell Infifiltration. *p < 0.05, **p < 0.01, and ***p < 0.001.

