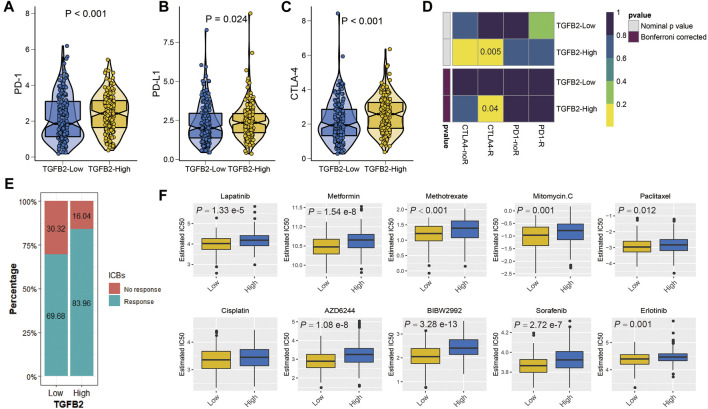
FIGURE 8.
TGFβ2 and immunotherapy and chemotherapy. Differences in immune checkpoints between high and low TGFβ2 groups, PD-1 (A), PD-L1 (B) and CTLA-4 (C). (D) Heatmap visualized the response to anti-CTLA4 and anti-PD1 therapies between the two groups. (E) The histogram showed the responsiveness of immunotherapy between high and low TGFβ2 groups, the height of each bar represents the frequency of change. (F) Boxplots depicted the differences in the estimated IC50 levels of Lapatinib, Metformin, Methotrexate, Mitomycin. C, Paclitaxel, Cisplatin, AZD6244, BIBW2992, Sorafenib and Erlotinib between the high and low TGFβ2 groups.

