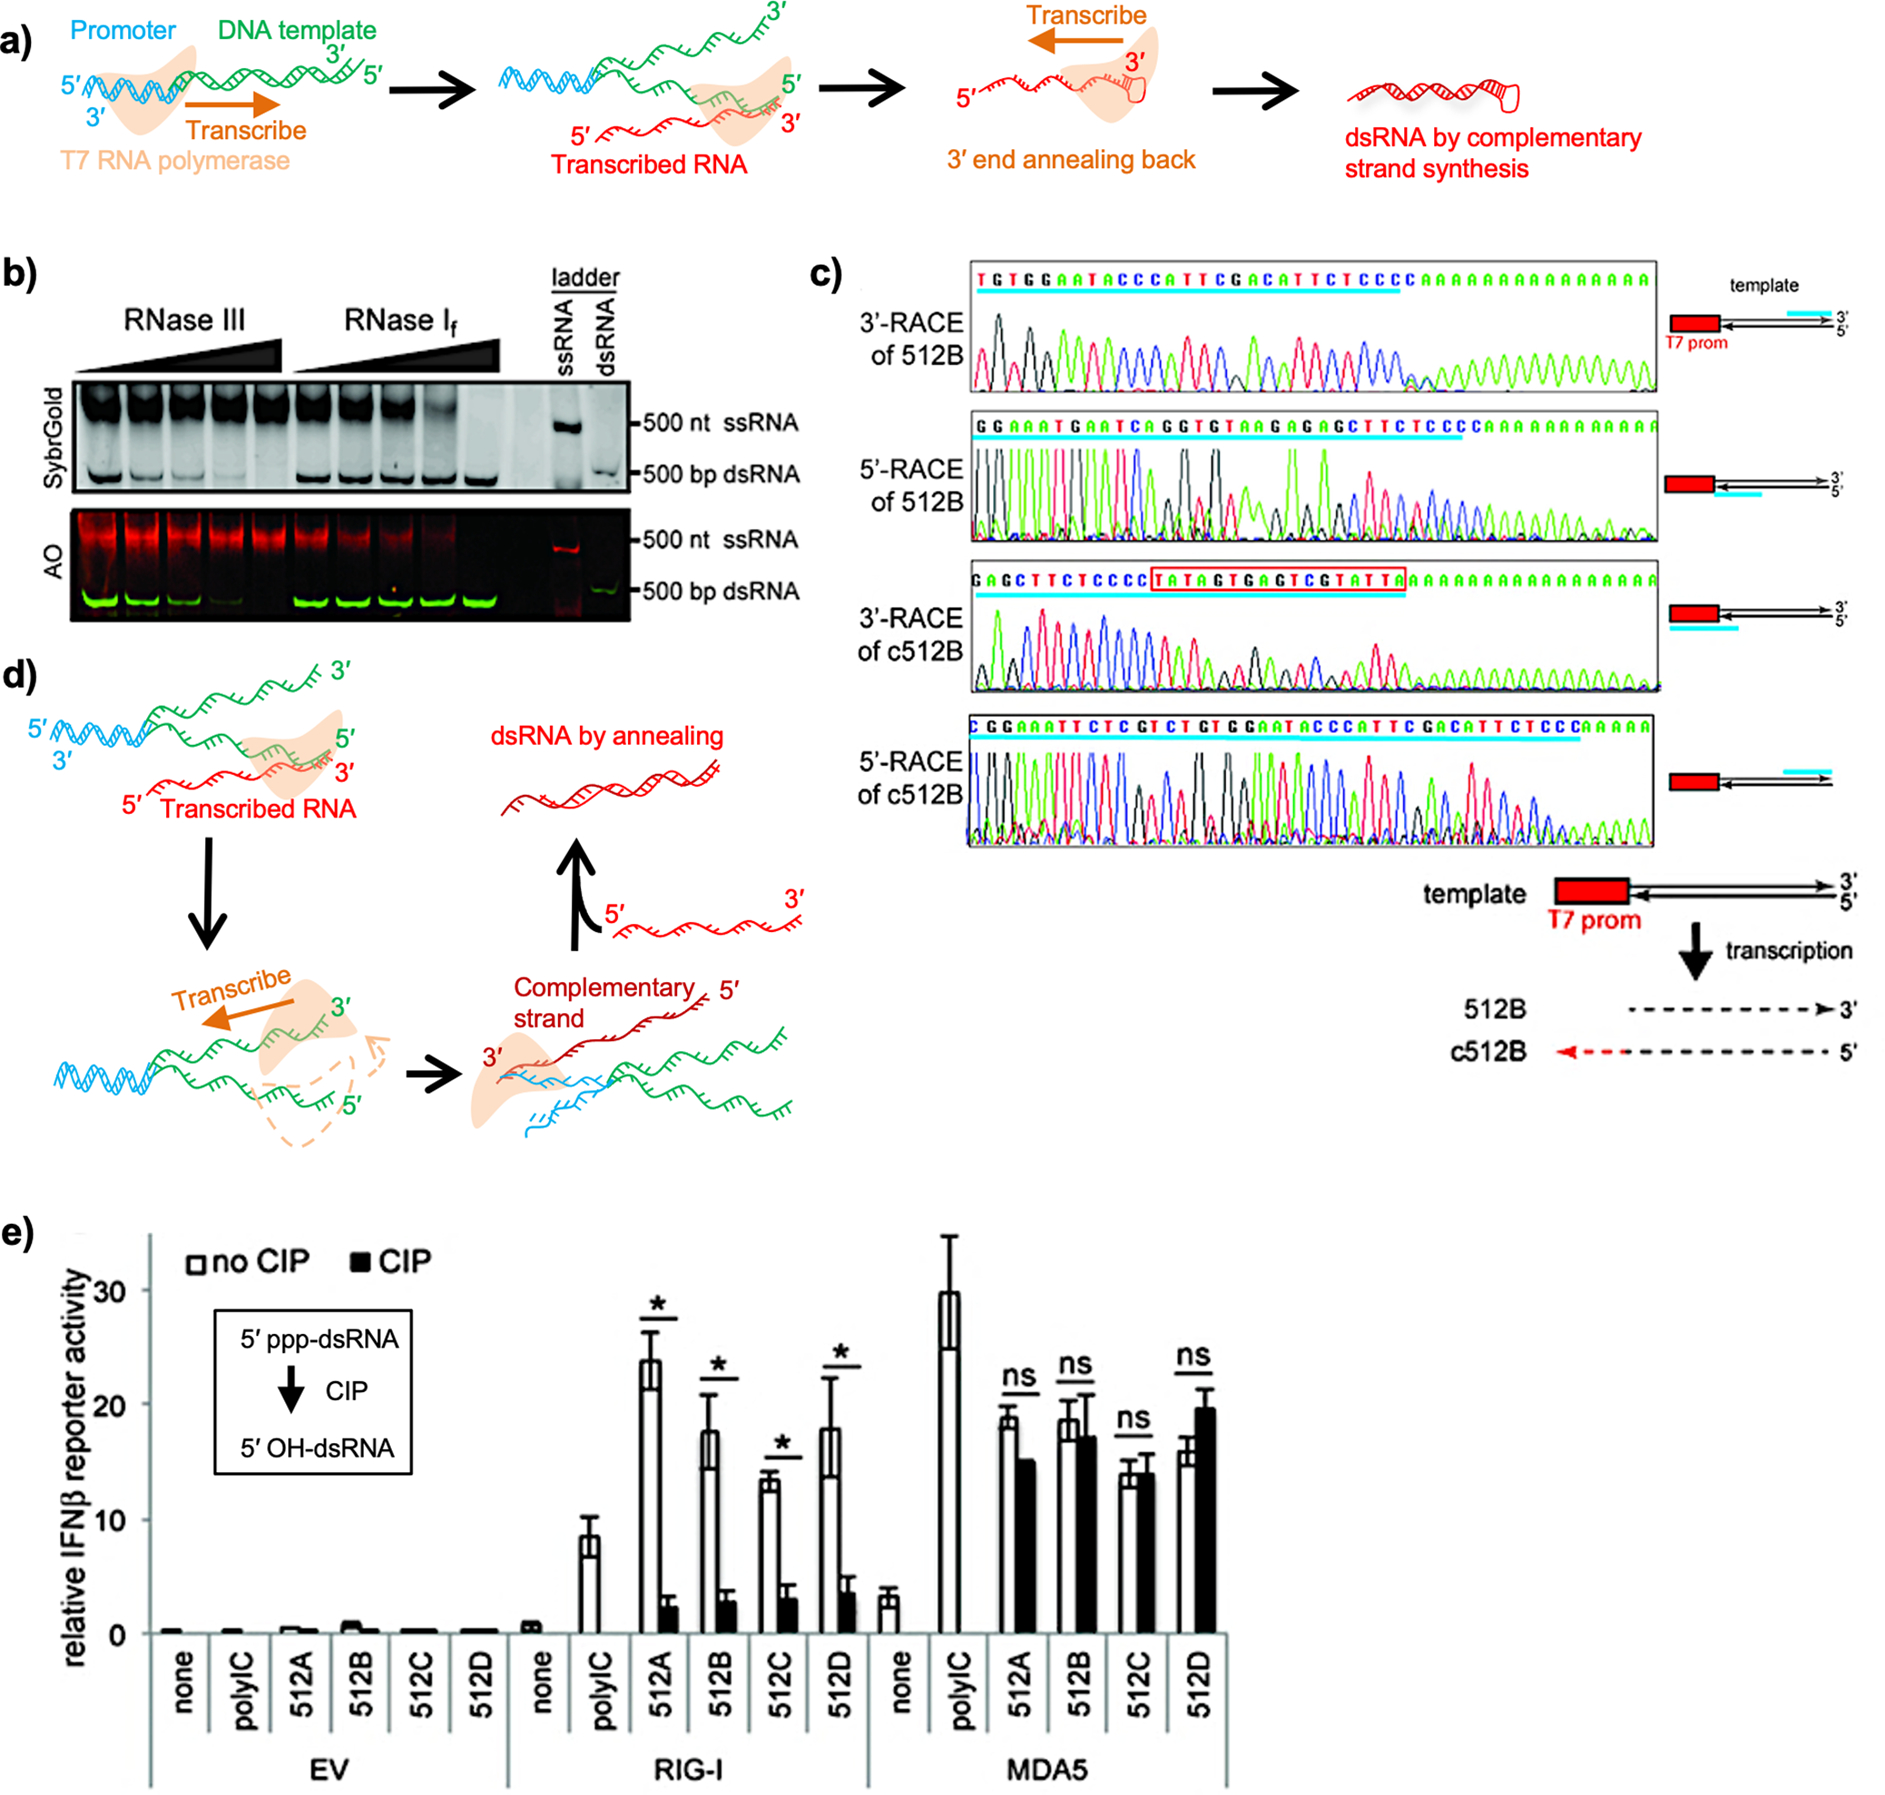
Figure 4.

(a) Schematic view of 3′-end extension-mediated dsRNA production by T7 RNA polymerase. The promoter region in the template DNA is shown in blue. Downstream sequences are shown in green. The transcribed RNAs are shown in red. The orange arrow indicates the direction of transcription. (b) Transcripts were challenged with RNase III or RNase I treatment and subjected to native PAGE analysis. The RNAs were visualized using SybrGold and AO. In AO staining, dsRNA is stained in green and ssRNA in red. (c) Start and end sites of sense (512B) and antisense (c512B) strands of transcripts were determined by 3′ and 5′ rapid amplification of cDNA ends (RACE). The schematic illustration of the sequencing results is shown at the bottom. (d) Schematic view of dsRNA production by the mechanism of annealing of sense and antisense strands. After RNA transcription by the sense strand, the RNA polymerase initiates RNA transcription by the antisense strand. The orange arrow indicates the direction of transcription. (e) A luciferase assay was done in HEK293T cells by cotransfection of RIG-I- or MDA5-expressing plasmids with luciferase reporters driven by IFNβ promoter, followed by transfection of stimulant RNAs indicated. CIP: calf intestinal phosphatase. (b), (c), and (e) Reprinted with permission from ref 4. Copyright 2018 Oxford University Press.
