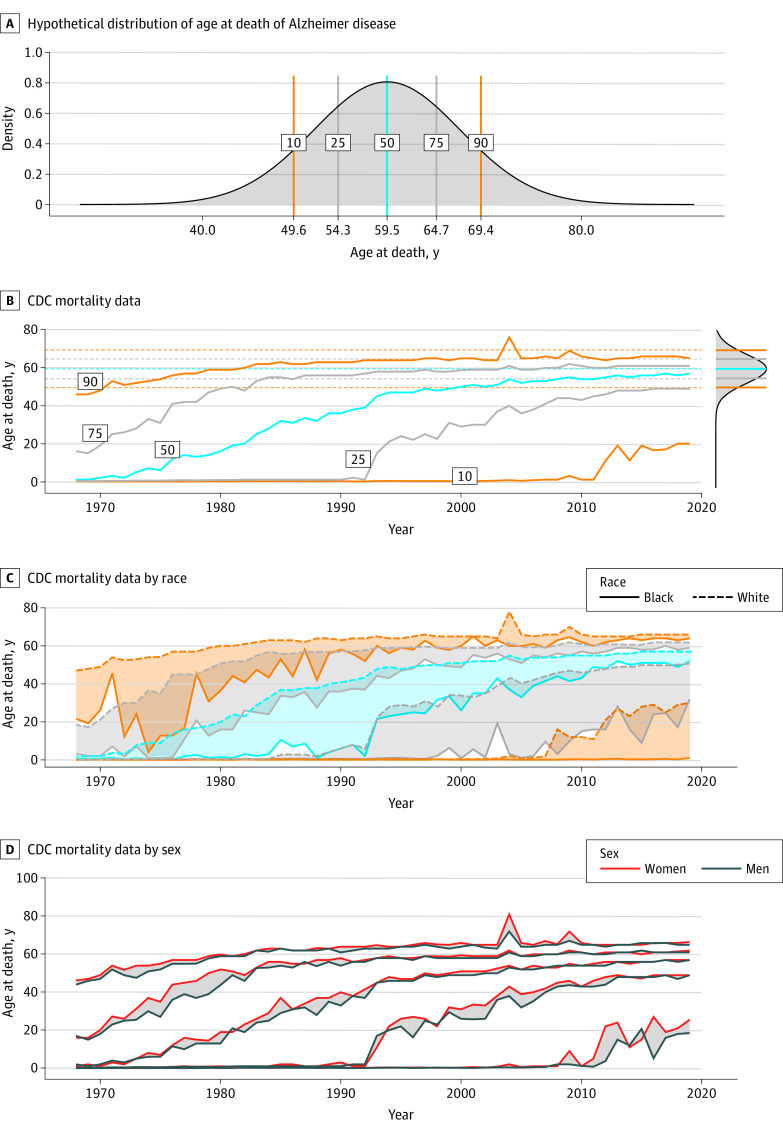
Figure 4. Association of Alzheimer Disease With Life Expectancy in People With Down Syndrome.
Panel A shows the hypothetical distribution of age at death in people with Down syndrome based on the data on age at onset and disease duration of Alzheimer disease dementia obtained in the systematic review and assuming full Alzheimer disease penetrance. Panel B shows the Centers for Disease Control and Prevention (CDC) mortality data of age at death in individuals with Down syndrome in the US between 1968 and 2019. The graph on the top right side of panel B is an overlay of the predicted percentiles based on the hypothetical distribution shown in panel A. CDC mortality data on age at death stratified by race (Panel C) and sex (Panel D). In panel C, orange lines indicate the 10th and 90th percentiles; gray lines indicate the 25th and 75th percentiles; and blue lines indicate the median. The shaded areas in panels C and D represent differences between each percentile according to race and sex.

