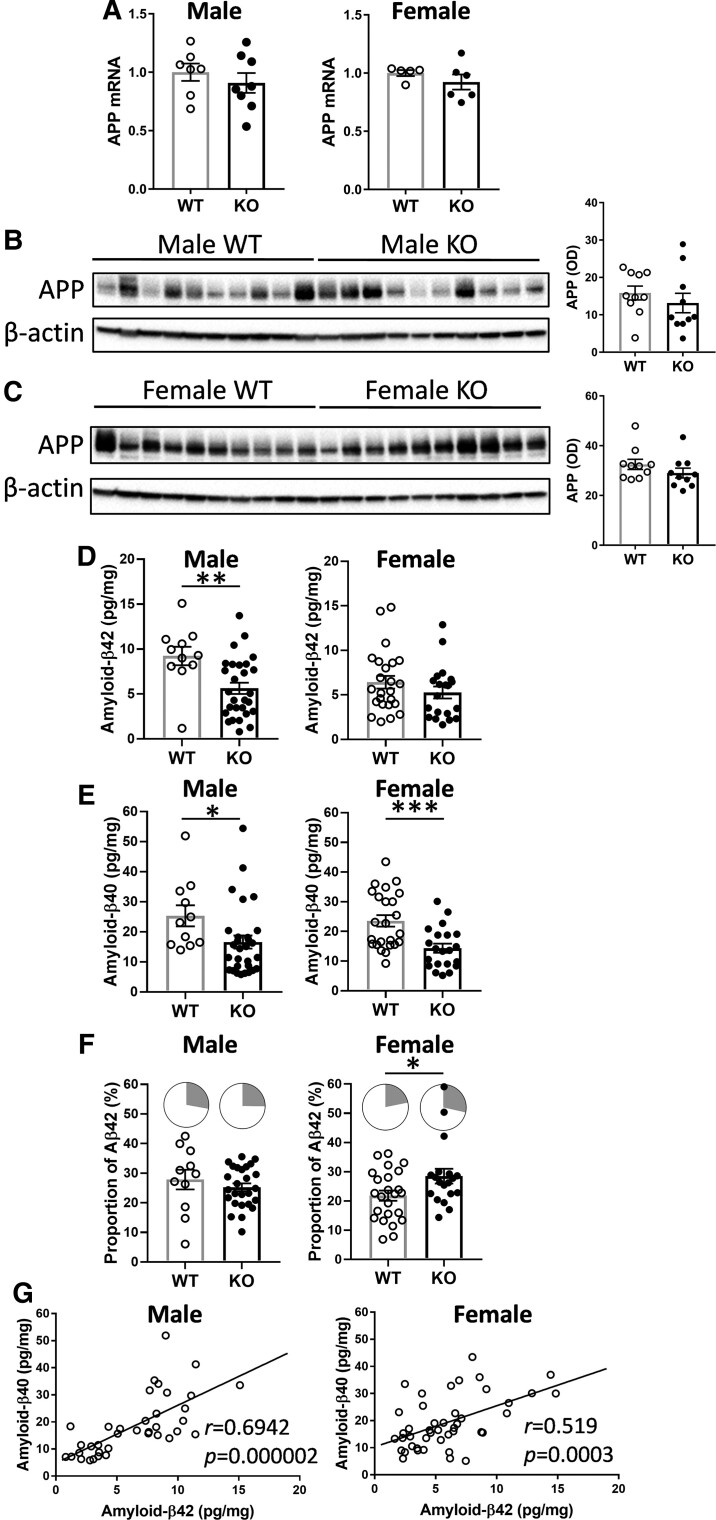
Figure 3.
Analysis of App expression in the Abca7 KO mouse brain. (A) App mRNA expression in male Abca7 KO (n = 8) versus WT (n = 7) and female Abca7 KO (n = 6) versus WT (n = 5), t-test, not significant. Each data point represents one animal. (B) App protein expression in male Abca7 KO (n = 10) compared with male WT (n = 10) mice and optical density (OD) measurement of the protein bands normalized to β-actin; t-test, not significant. Each data point represents one animal. (C) App protein expression in female Abca7 KO (n = 10) compared with female WT (n = 10) mice and OD measurement of the protein bands normalized to β-actin; t-test, not significant. Each data point represents one animal. (D) Amyloid-β42 levels in male Abca7 KO (n = 31) versus WT (n = 11) and female Abca7 KO (n = 21) versus WT (n = 24); t-test, **P < 0.005 t = 3.024. Each data point represents one animal. (E) Amyloid-β40 levels in male Abca7 KO (n = 31) versus WT (n = 11) and female Abca7 KO (n = 21) versus WT (n = 24); t-test, *P < 0.05 t = 2.117, ***P < 0.0005, t = 3.665. Each data point represents one animal. (F) Proportion of amyloid-β42 (grey sector) to total amyloid-β in male Abca7 KO (n = 31) versus WT (n = 11) and female Abca7 KO (n = 21) versus WT (n = 24); t-test, *P < 0.05 t = 2.230. Each data point represents one animal. (G) Correlation of amyloid-β42 and amyloid-β40 in male (n = 42) and female (n = 45) mouse brain.

