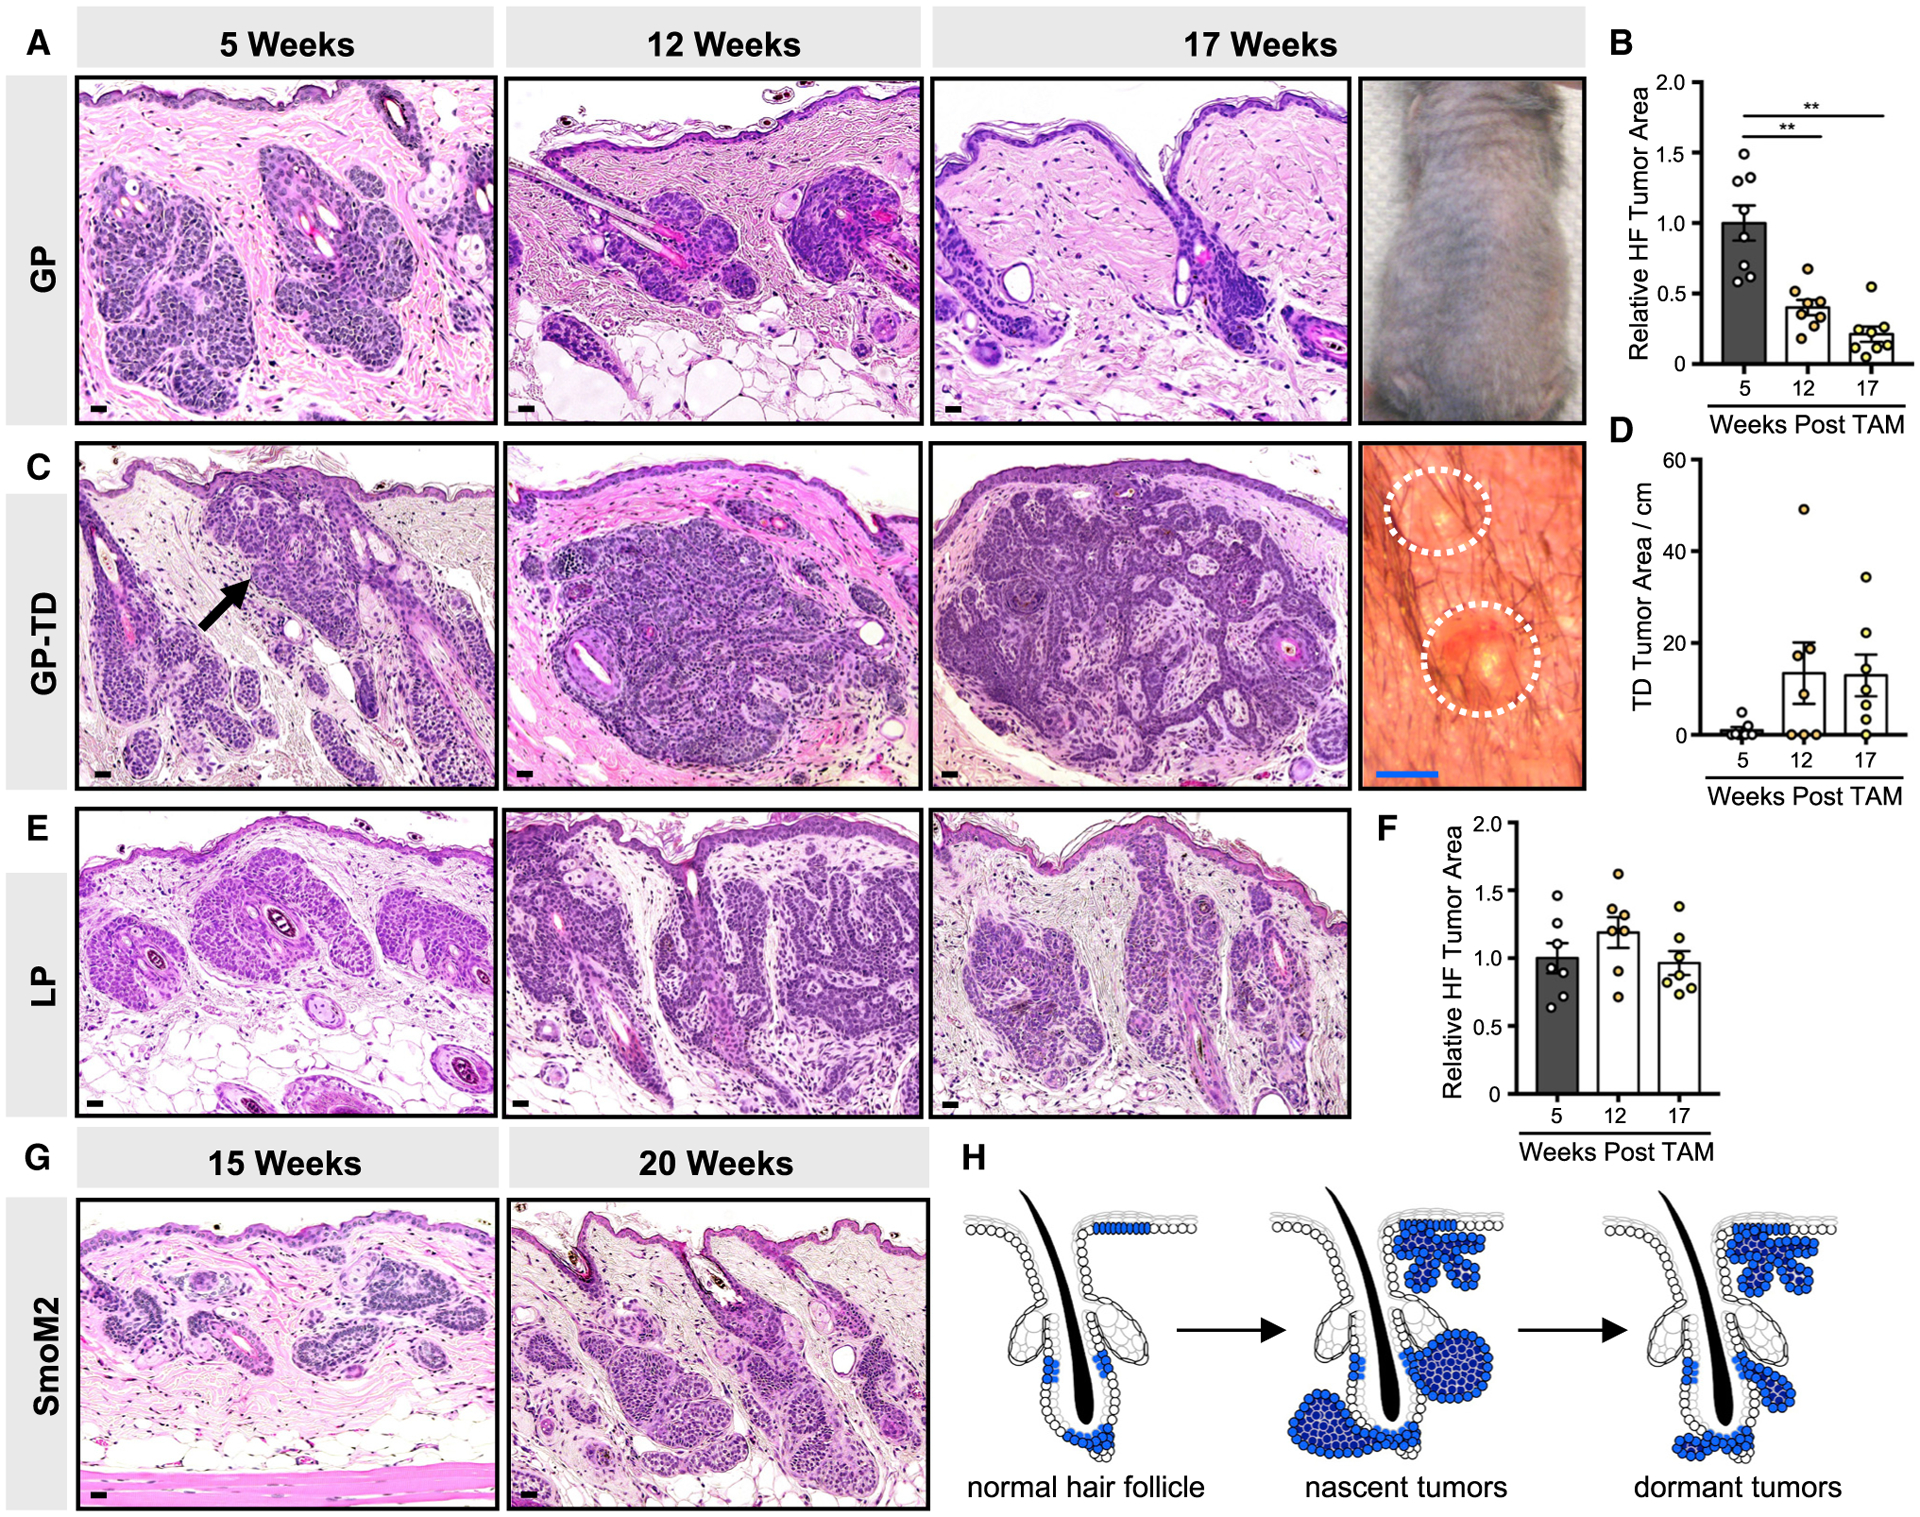
Figure 1. Microscopic tumors initiated by activation of upstream Hh signaling fail to progress.

(A) Histology of hair follicle (HF)-associated GP tumors, 5–17 weeks post-TAM. Right photo shows shaved dorsal skin devoid of palpable tumors, 17 weeks post-TAM.
(B) Quantitation of HF-associated tumor area.
(C) Histology of touch dome (TD)-derived GP tumors (arrow), 5–17 weeks post-TAM. Right photo shows view of small TD papules, ~1 mm diameter.
(D) Quantitation of TD-derived tumor area, in arbitrary pixel units per cm.
(E) Histology of HF-derived LP tumors, 5–17 weeks post-TAM.
(F) Quantitation of LP tumors.
(G) Histology of microscopic HF-associated SmoM2 tumors arising from Lrig1+ stem cells (left, 15 weeks post-TAM) or Gli1+ stem cells (right, 20 weeks post-TAM).
(H) Schematic of GP tumor kinetics.
Data are represented as mean ± SEM, with significance calculated by one-way ANOVA. **p < 0.01. Scale bars, 50 μm. Blue scale bar, 1 mm.
