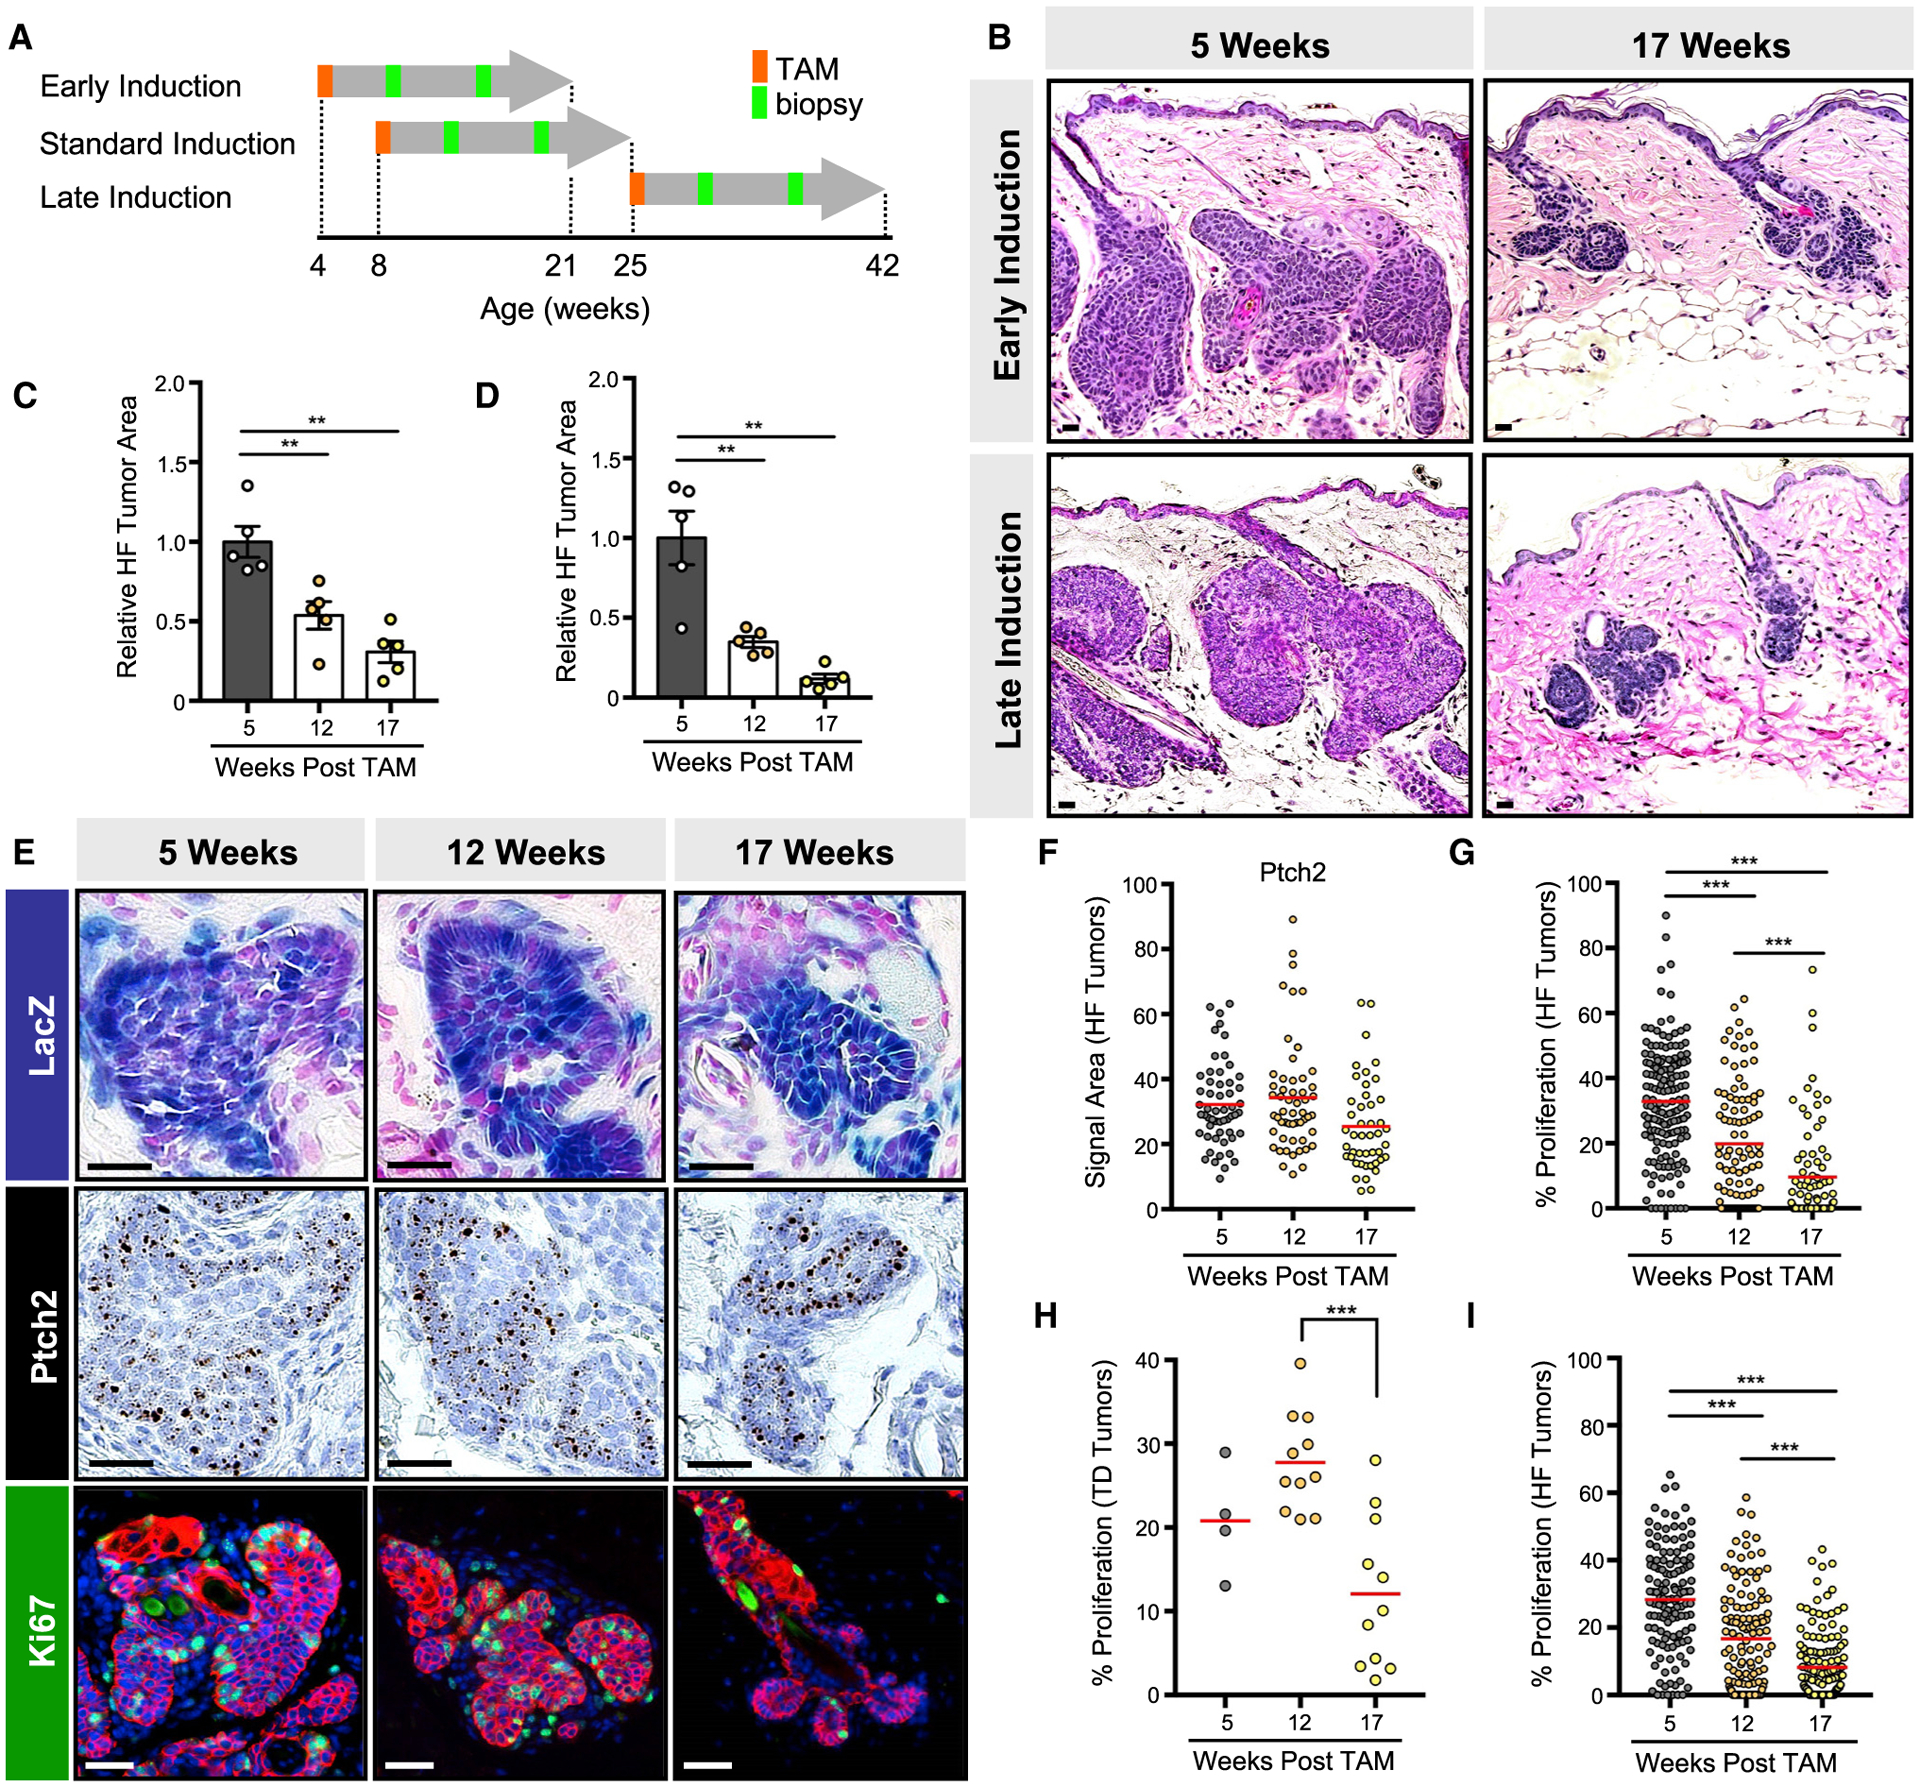
Figure 2. Microscopic tumors exhibit reduced proliferation over time.

(A) Schematic for TAM induction and skin biopsy in GP mice. Mice were also biopsied at the end of the experiment.
(B) GP tumors regress by 17 weeks post-TAM, regardless of induction scheme.
(C) Quantitation of tumor area in early-induced GP mice.
(D) Same as (C) but for late-induced GP mice.
(E) GP tumors maintain elevated Hh signaling, as assessed by LacZ (top panels) and Ptch2 mRNA (middle panels), but reduce their proliferation over time, as assessed by Ki67 (green, lower panels). Red, keratin 14 (K14).
(F) Quantitation for Ptch2 in HF-associated GP tumors.
(G) Quantitation of proliferation in HF-associated GP tumors.
(H) Same as (G) but for touch-dome-derived GP tumors.
(I) Quantitation of proliferation in LP tumors.
For (E)–(I), analysis was performed on tumors arising from the standard induction scheme. Data are represented as mean ± SEM, with significance calculated by one-way ANOVA. Significance for beeswarm plots was calculated using a linear mixed model. **p < 0.01; ***p < 0.001. Scale bars, 50 μm. See also Figures S1 and S2.
