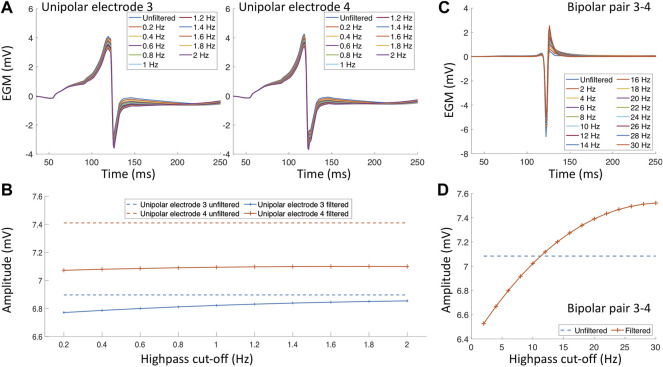
FIGURE 3.
Filter effects on electrograms measured in healthy myocardium. (A) Unipolar electrograms with different highpass filter values. (B) Effect of different highpass cut-off values on the unipolar electrogram amplitude. (C) Bipolar electrogram with different highpass cut-off values. (D) Effect of different highpass cut-off values on the bipolar electrogram amplitude.

