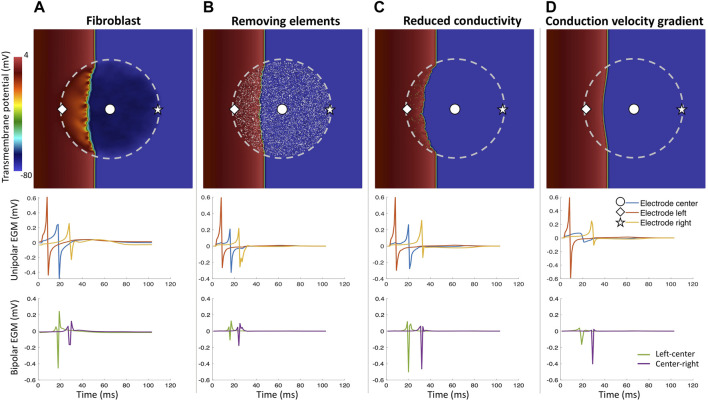
FIGURE 7.
Different fibrosis modeling methodologies and their corresponding unipolar and bipolar electrograms. Central fibrotic area (dashed line), the choice of the modeling approach affects the resulting uEGMs and biEGMs. (A) fibroblasts coupled to myocytes in the fibrotic region; (B) removing a share of elements in the fibrotic region from the computational domain; (C) severely reducing conductivity in a share of elements in the fibrotic region but the spatial transmembrane voltage gradients of fibrotic elements still contribute to the EGMs; (D) conductivity gradient from center of the fibrotic region to the surrounding healthy tissue. Absolute EGM amplitudes are smaller than in vivo due to the small size of the tissue patch.

