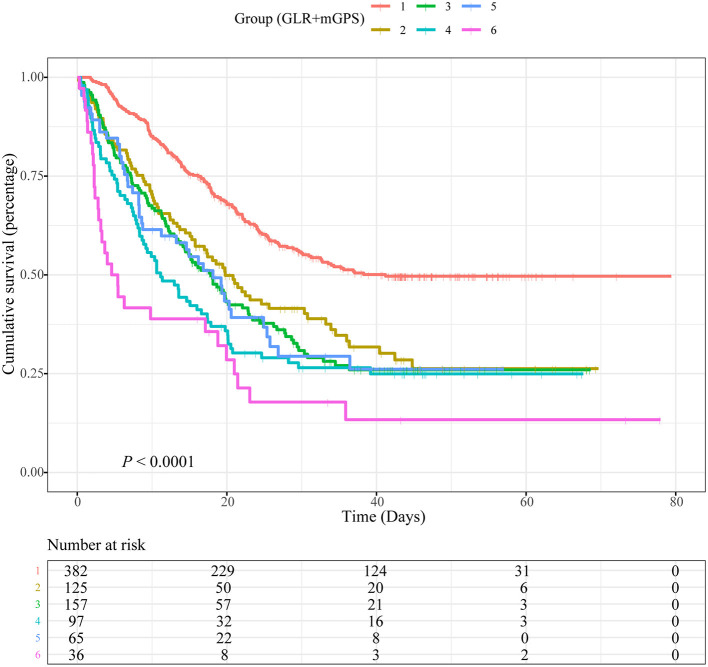
Figure 3.
Kaplan-Meier curves showing associations between a combination of blood glucose to lymphocyte ratio (GLR) and modified Glasgow prognostic score (mGPS) and overall survival (OS) in patients with non-small cell lung cancer (NSCLC). Group 1: Low GLR and mGPS = 0; Group 2: High GLR and mGPS = 0; Group 3: Low GLR and mGPS = 1; Group 4: High GLR and mGPS = 1; Group 5: Low GLR and mGPS = 2; Group 6: High GLR and mGPS = 2.

