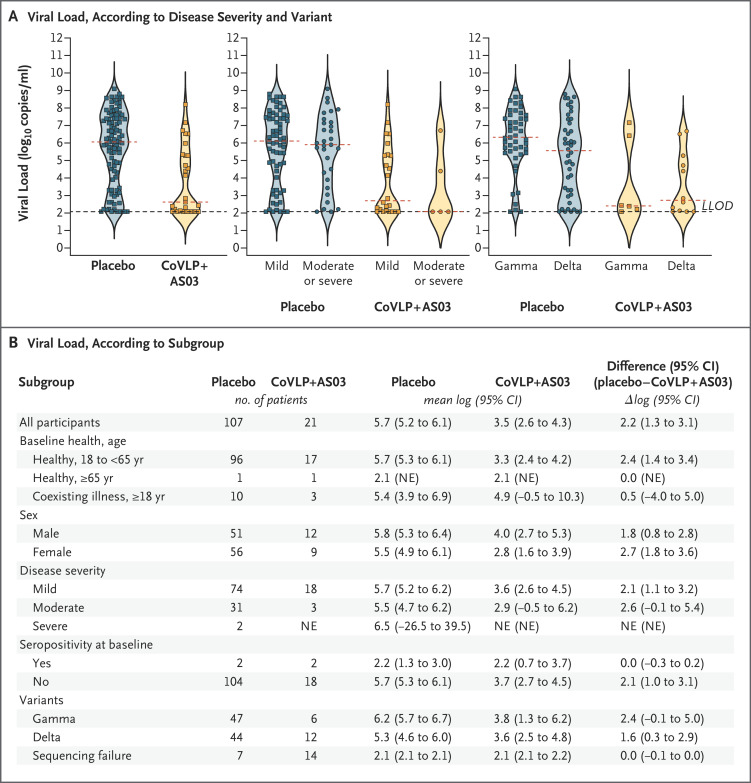
Figure 4. Viral Load at the Time of Covid-19 Diagnosis.
Panel A shows viral loads for patients for whom data were available in the two groups, arranged in violin plots. Within each plot, the red dashed line indicates the median, and the black dashed line indicates the lower limit of detection (LLOD). Panel B shows mean viral loads, presented as log10 virus copies per milliliter, according to subgroup. All analyses were performed in the intention-to-treat population. NE denotes not estimable.

