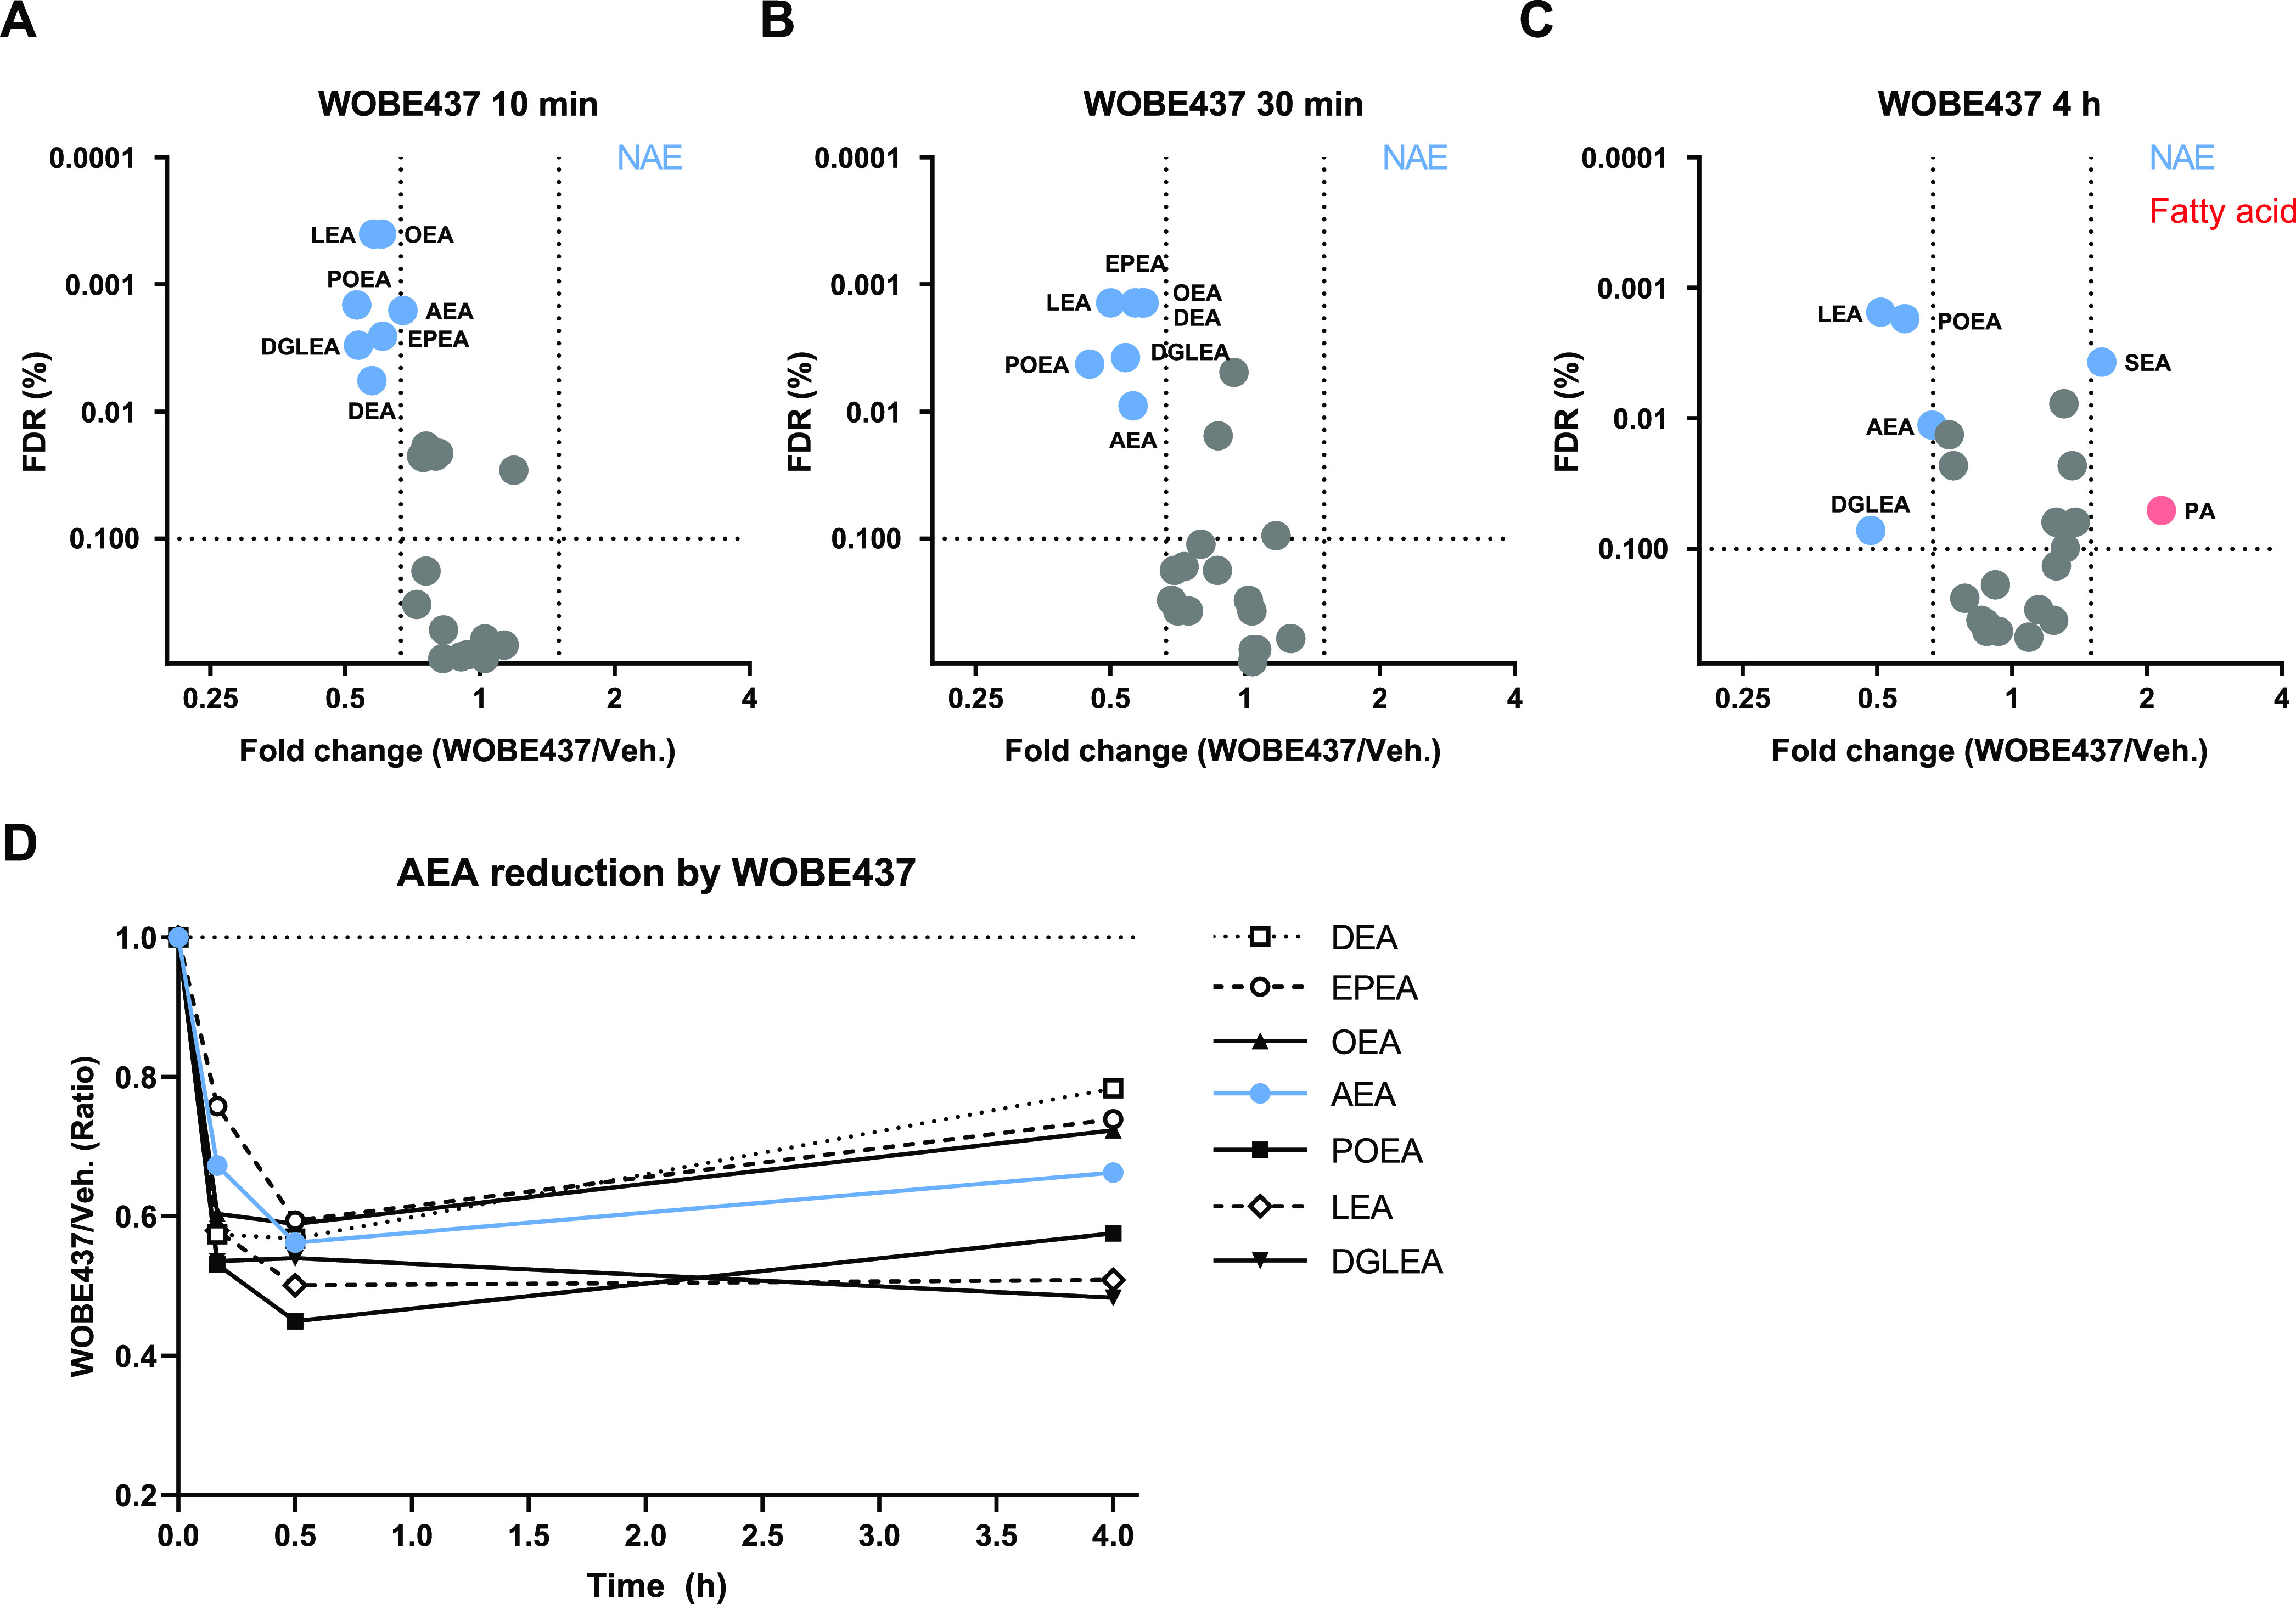
Figure 3.

WOBE437 disrupts cellular NAE levels within 10 min of treatment. Neuro-2a cells were treated with 10 μM WOBE437 or vehicle and harvested at the indicated time points to be analyzed by MS-based lipidomics. (A–C) Lipidomic data are presented as a volcano plot, and lipids with a fold-change threshold of ≥1.50 or ≤0.67 and a Benjamini-Hochberg false-discovery rate (FDR) ≤10% following a Student’s t-test are represented by colored circles indicating lipid class. (D) Fold-change of altered NAEs is represented as a function of time. The complete list of ratios at 30 min are depicted in Figure S1.
