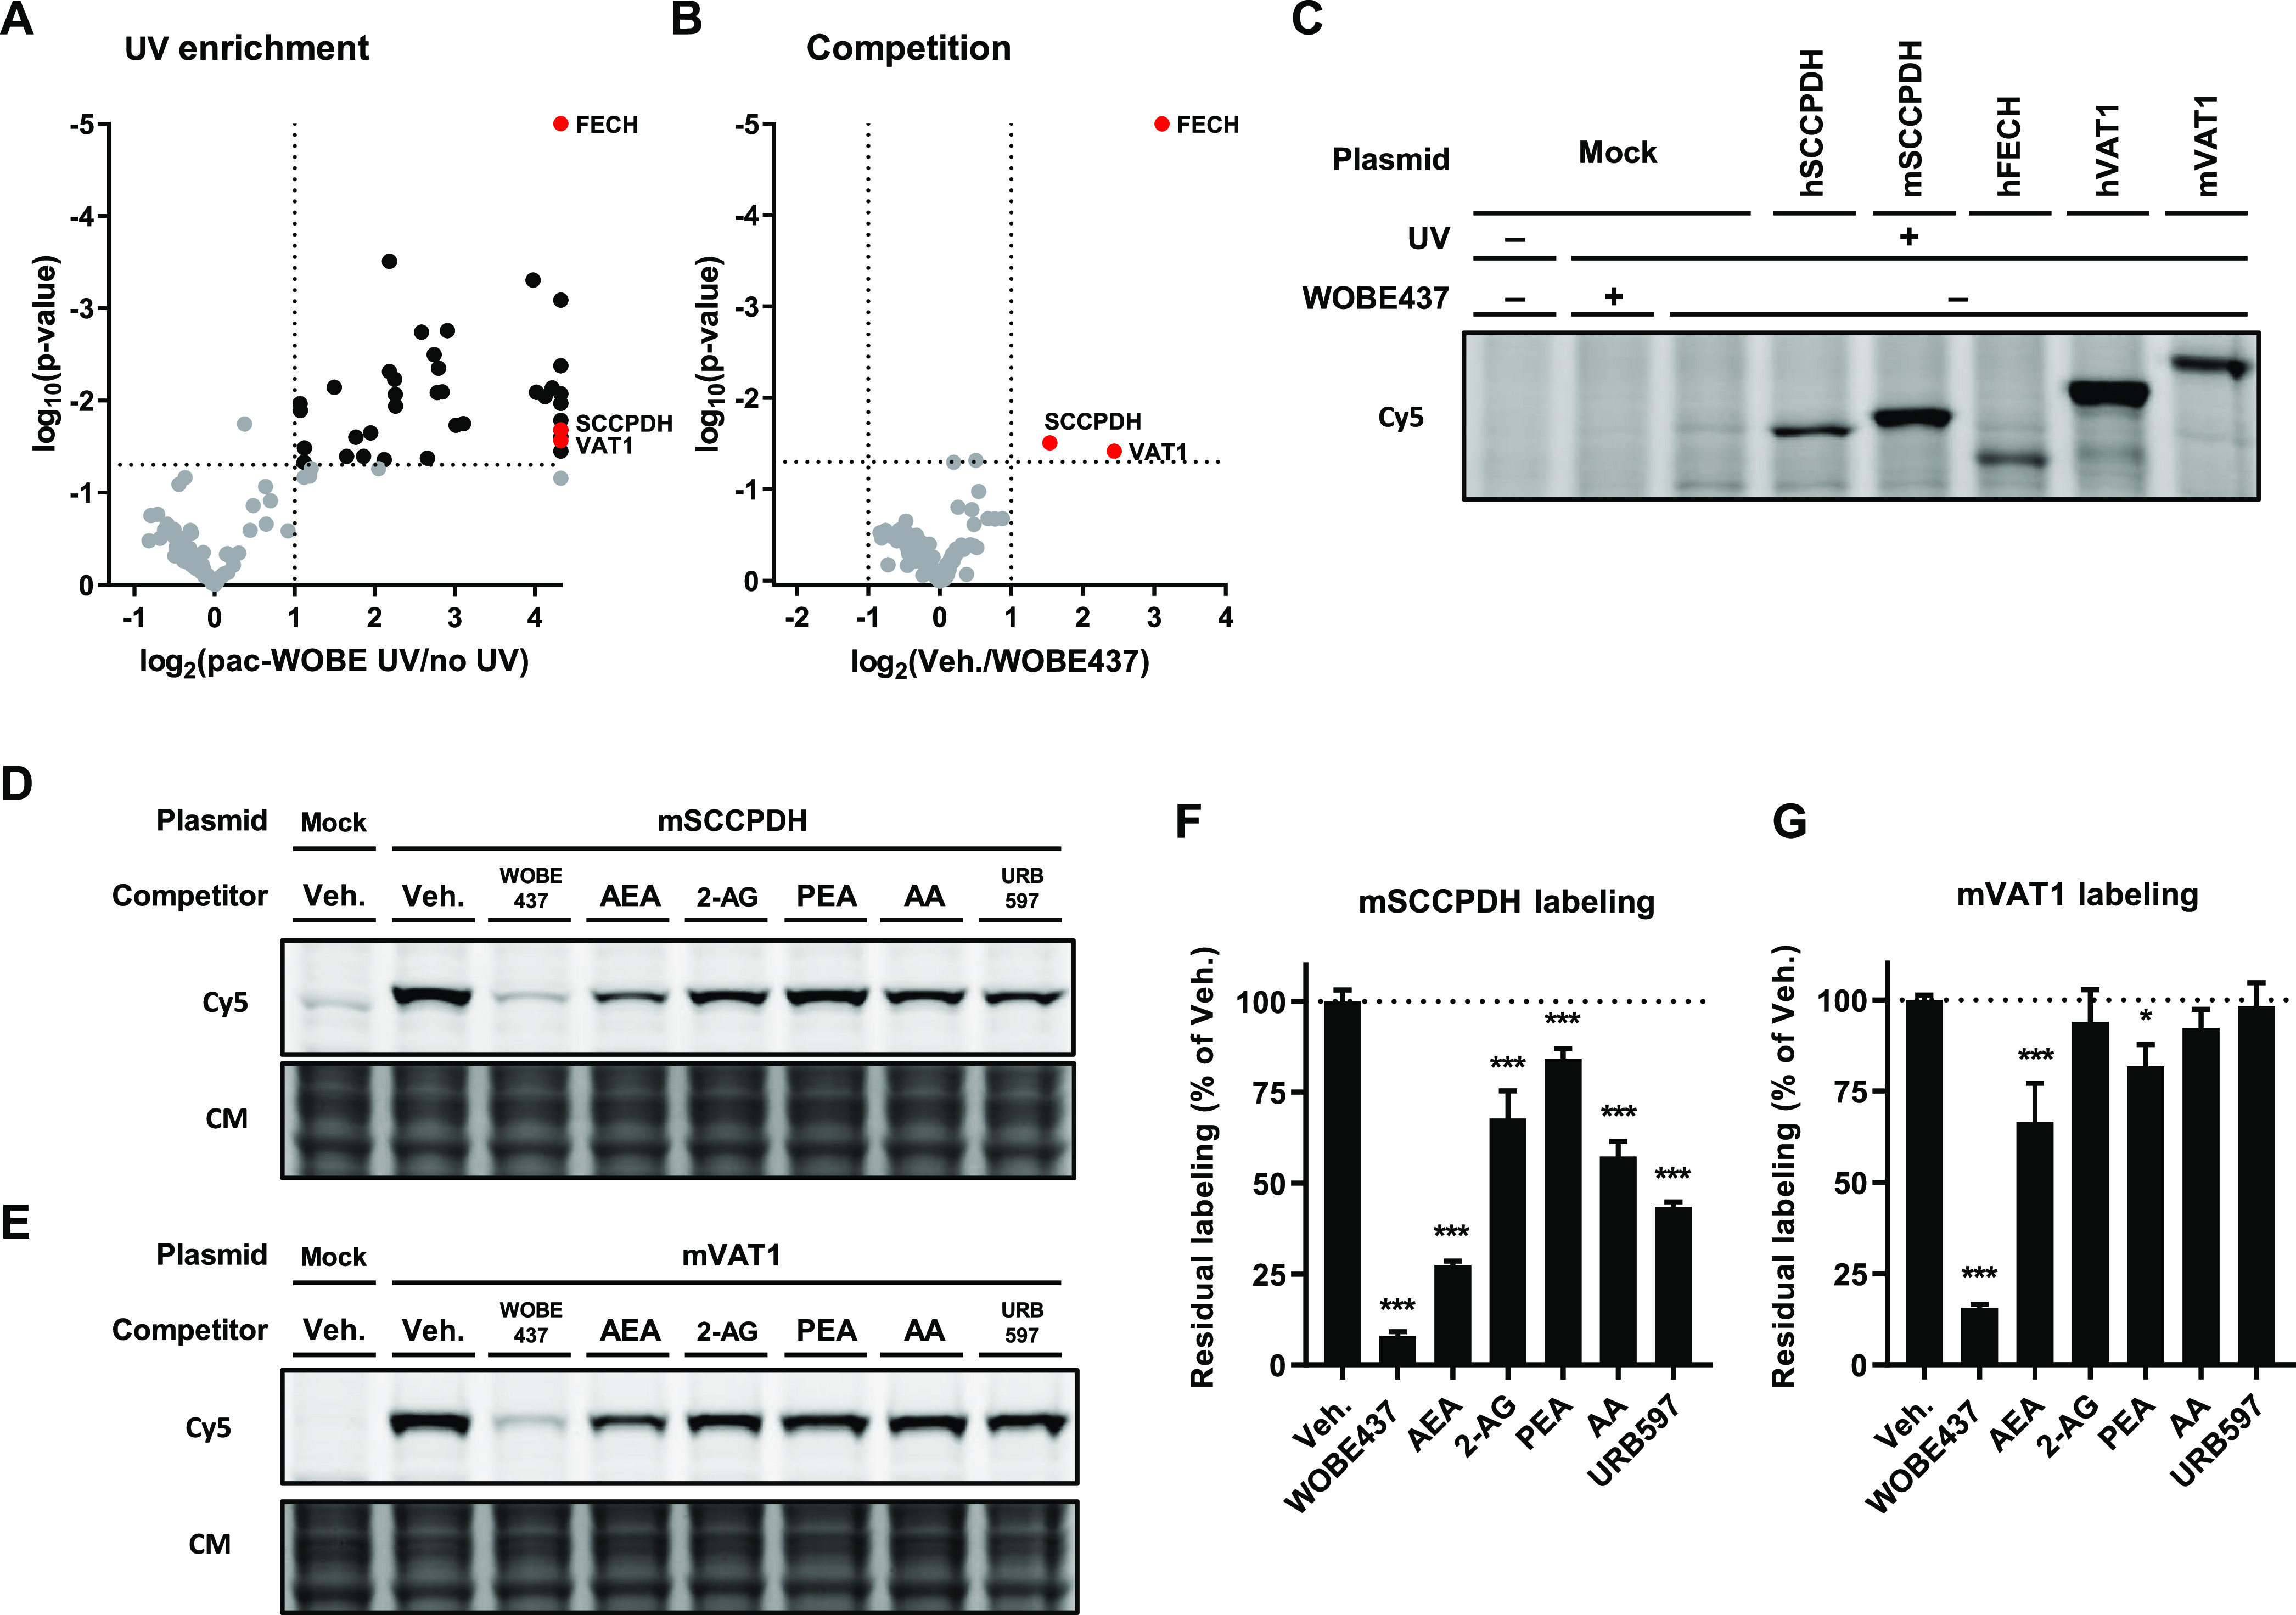
Figure 5.

Identification and characterization of WOBE437 targets using pac-WOBE (3). Volcano plot depicting (A) UV enrichment and (B) WOBE437 competition of proteins labeled by in situ AfBPP in Neuro-2a cells using 1 μM pac-WOBE (3). UV enrichment is capped at 20-fold, p-value at 0.00001. A complete list of targets is available in Table S4. (C) Gel-based AfBPP profiling of overexpressing HEK-293-T cells using 0.1 μM pac-WOBE (3). (D,E) Representative gels of competition of 0.1 μM pac-WOBE (3) labeling of overexpressing HEK-293-T cells by 10 μM of the indicated compound. (F,G) Quantified residual labeling of indicated protein by 0.1 μM pac-WOBE (3) after preincubation with the indicated compound. Fluorescent signal was normalized to quantified Coomassie signal. Data represent means ± SD of three biological replicates. *p < 0.05; ***p < 0.001 in comparison to vehicle-treated control (dotted line) using one-way ANOVA with Dunnett’s multiple comparisons correction.
