Figure 6.

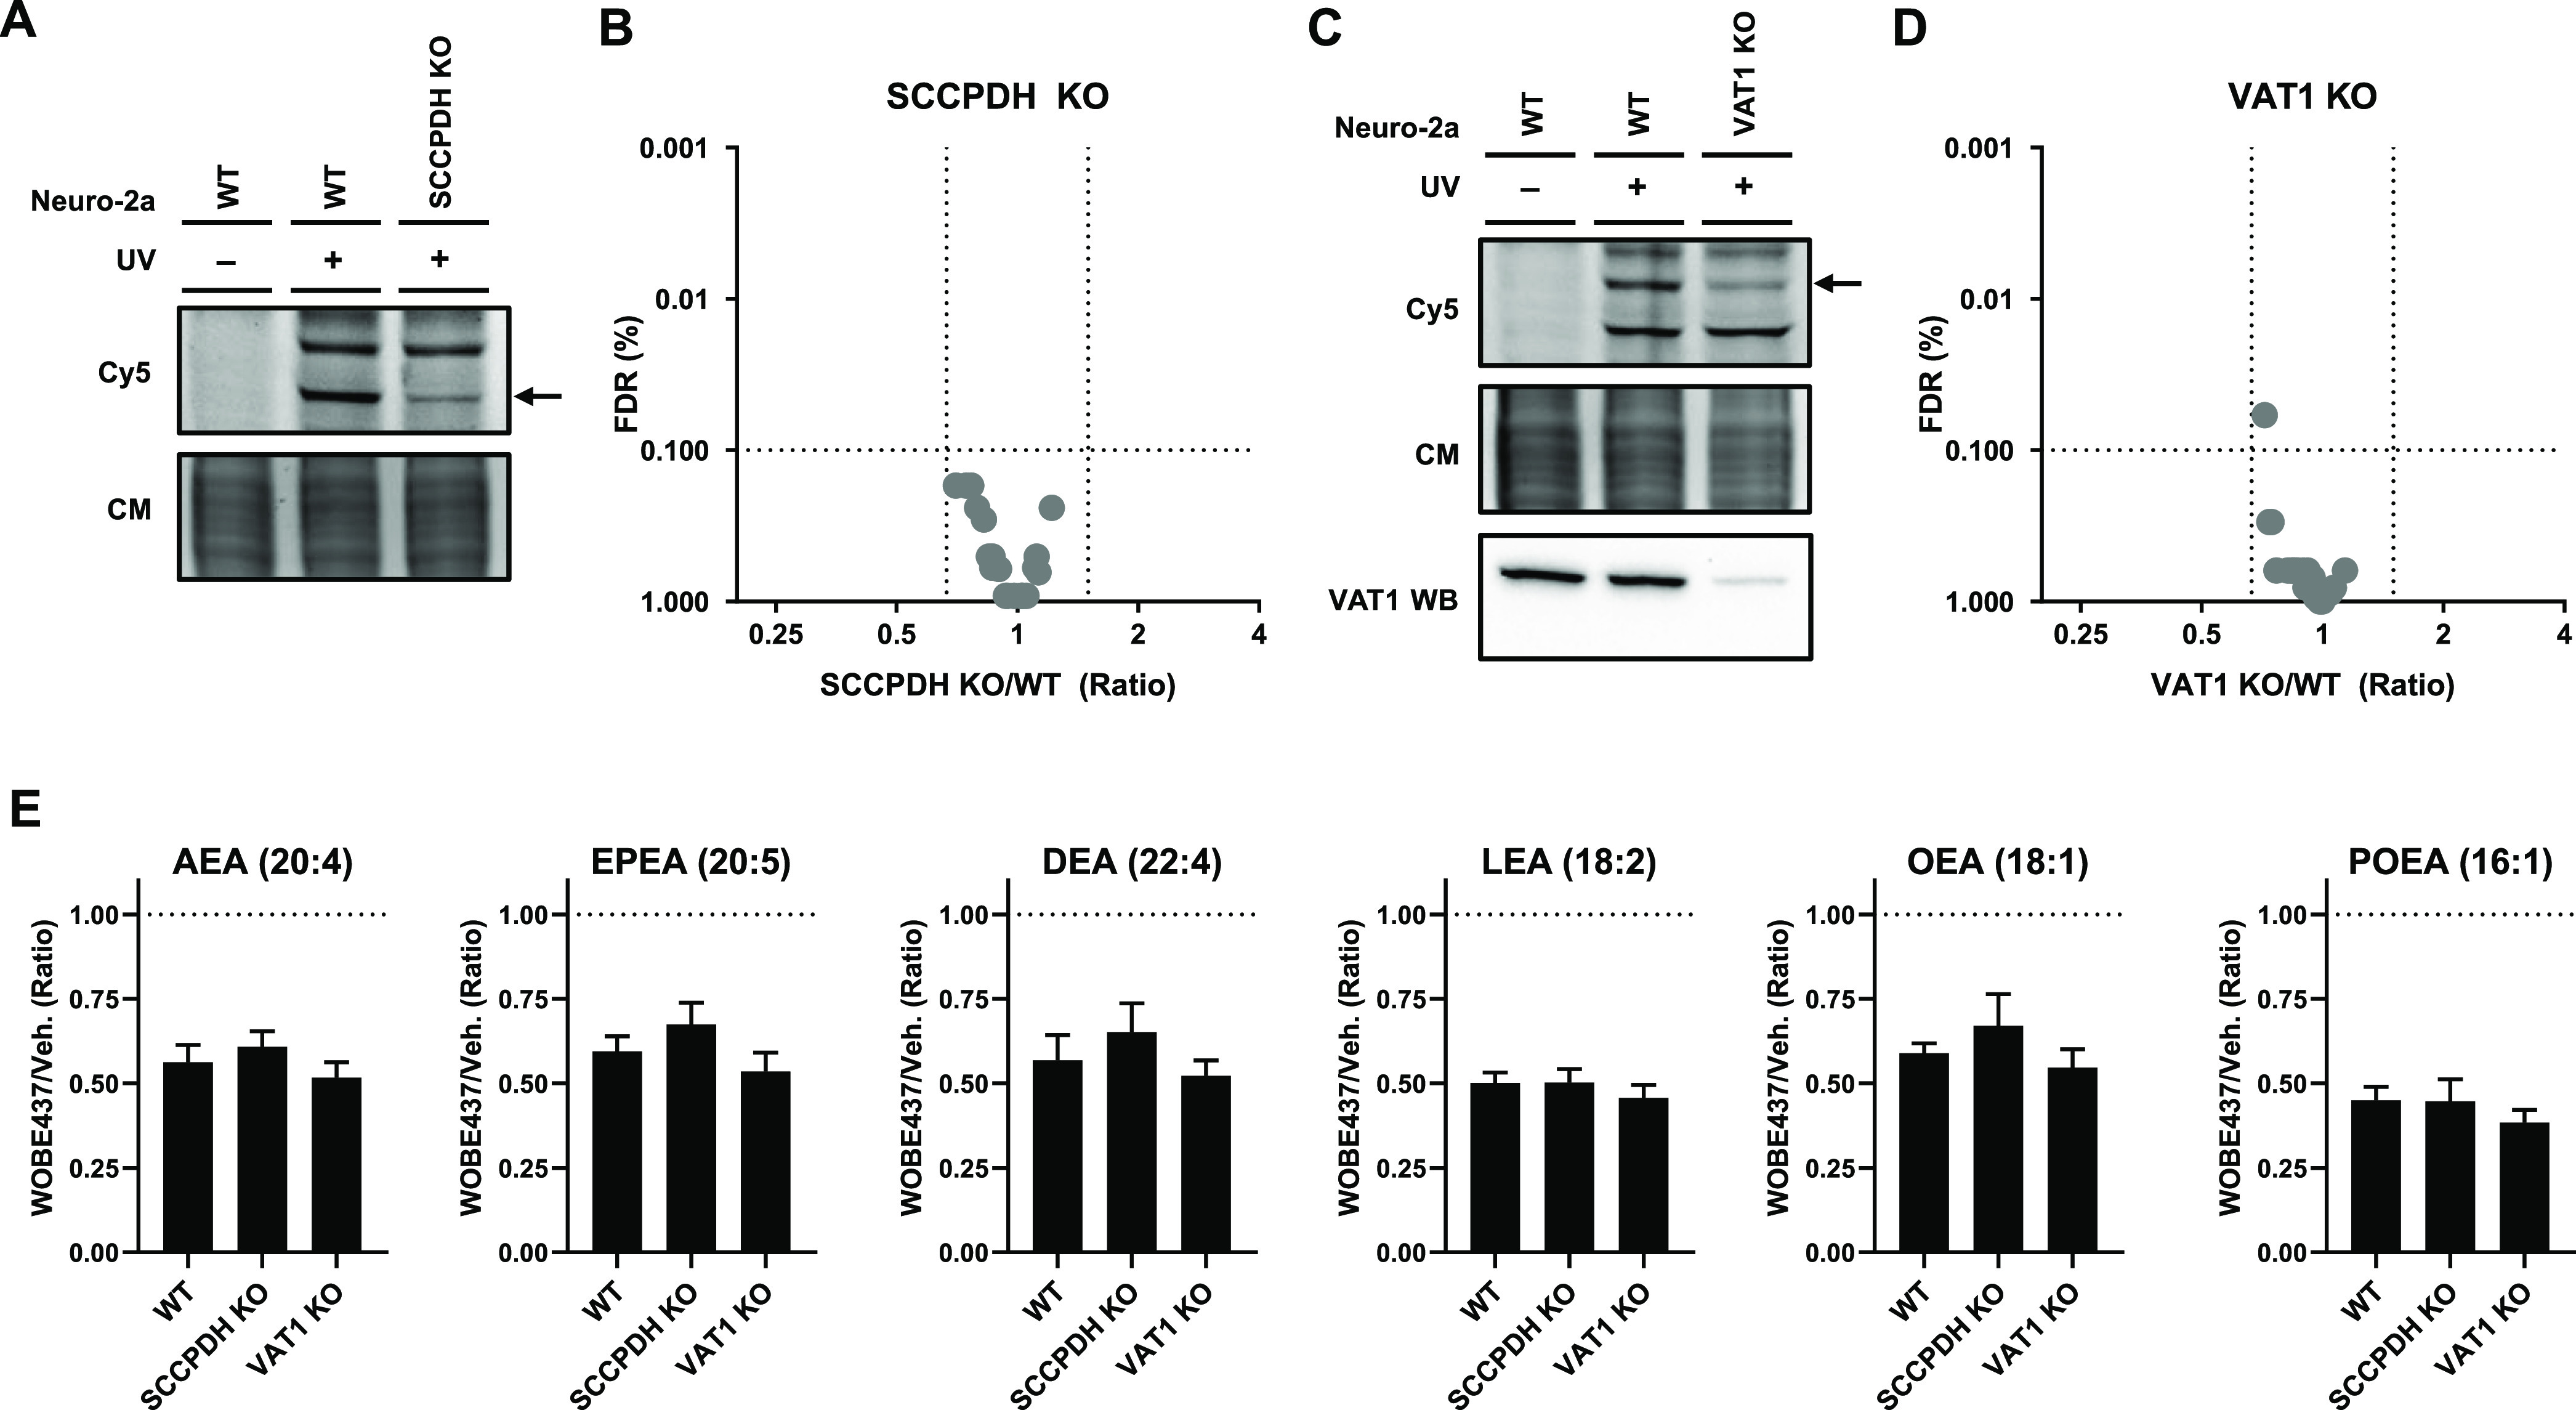
Partial SCCPDH and VAT1 knockouts were generated by CRISPR-Cas9. (A) SCCPDH and (C) VAT1 KO Neuro-2a lines were generated and checked by gel-based AfBPP using 0.1 μM pac-WOBE (3) for residual expression. VAT1 protein was tested by VAT1 Western blot. Coomassie served as a protein loading control. Lipid levels were tested by lipidomics on (B) SCCPDH KO and (D) VAT1 KO cells and compared to WT cells. Further characterization and the complete list of ratios are depicted in Figures S6 and S7. (E) Neuro-2a cells were treated with 10 μM WOBE437 or vehicle for 30 min and harvested to be analyzed by MS-based lipidomics. Lipid levels are displayed as ratio against the same type of cells treated with vehicle. Data represent means ± SEM (n = 4). One-way ANOVA with Dunnett’s multiple comparisons correction: not significant when compared to WT.
