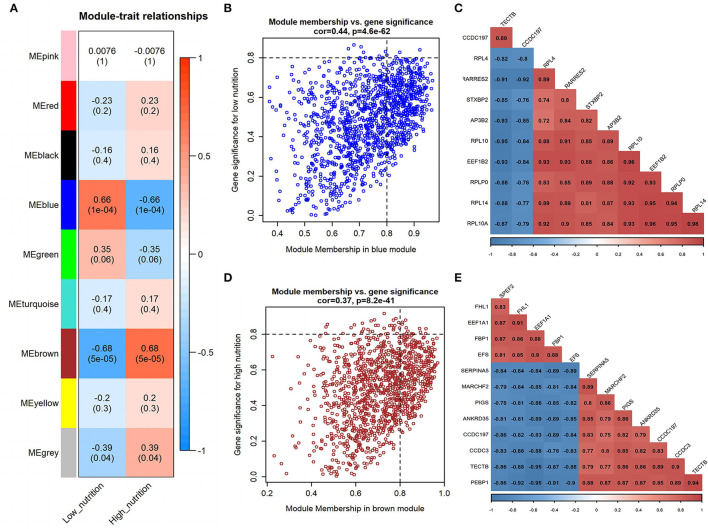
Figure 2.
Module-trait correlations analysis in visceral adipose tissue (PRJNA664093). (A) Correlation heatmap between modules and nutrition levels. The correlation coefficient and P-value are labeled in the rectangle. (B) The MM and GS for low nutrition in the blue module. The dots represent genes in the blue module, the horizontal axis is the MM value, and the vertical axis is the GS value for low nutrition. (C) The correlation relationship of the top 10 genes with high MM and GS in the blue module. The correlation coefficients are labeled in the rectangle. (D) The MM and GS for high nutrition in the brown module. The dots represent genes in the brown module, the horizontal axis is the MM value, and the vertical axis is the GS value for high nutrition. (E) The correlation relationship of the top 12 genes with high MM and GS in the brown module. The correlation coefficients are labeled in the rectangle.

