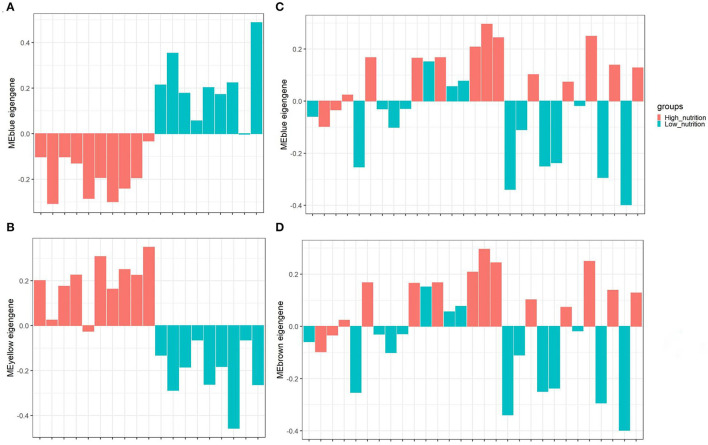
Figure 3.
The distribution of MEs among different groups of samples. The blue module (A) and yellow module (B) identified in subcutaneous adipose tissue (PRJNA382633). The blue module (C) and brown module (D) identified in visceral adipose tissue (PRJNA664093). The horizontal axis represents the sample, and the vertical axis represents the ME value. The color represents the group of samples indicated in the upper right corner.

