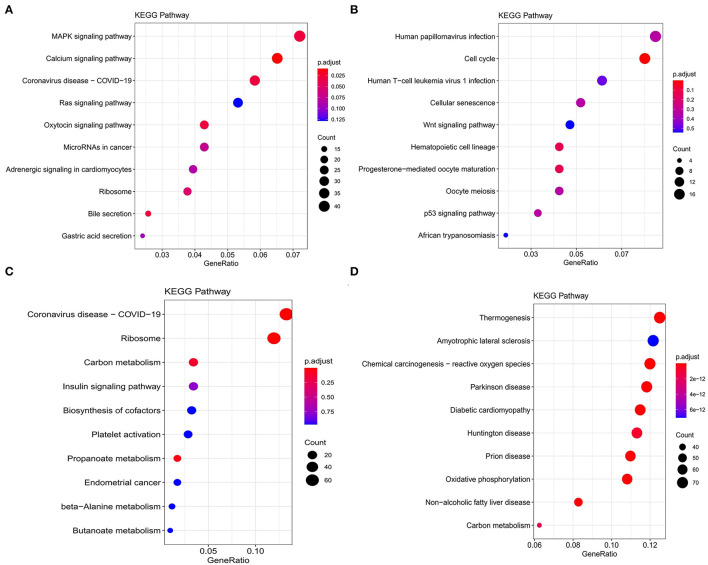
Figure 4.
Kyoto Encyclopedia of Genes and Genomes (KEGG) functional enrichment analysis of modules that are most associated with nutrient levels. In subcutaneous adipose tissue, genes from the blue and yellow modules that significantly related to low nutrition (A), and high nutrition (B) were analyzed. In visceral adipose tissue, genes from the blue and brown modules that significantly related to low nutrition (C), and high nutrition (D) were analyzed. The top 10 significantly enriched pathways were shown.

