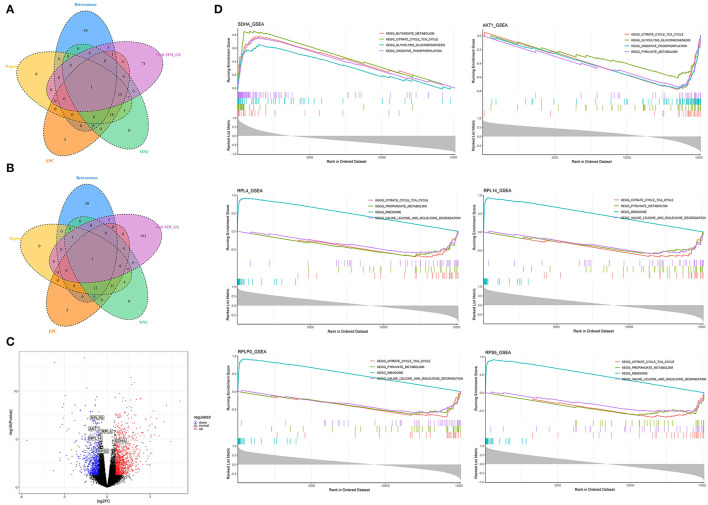
Figure 7.
Identification and analysis of hub genes related to nutrition levels in visceral adipose tissue. (A,B) The intersection of the potential hub genes and the top 50 hub genes identified by four algorithms (MNC, EPC, Betweenness, and Degree) in the blue module (A) and brown module (B). (C) Volcano plot of differential expressed genes between high and low nutrition levels. Red and blue dots represent the upregulated and downregulated genes comparing the high nutrition group with the low. The identified hub genes are labeled with the triangle. (D) GSEA analysis of hub genes related to nutrition levels in visceral adipose tissue. The horizontal axis represents the ranked gene list according to the correlation with the hub gene. The vertical axis represents enrichment scores (upper) and the correlation coefficients with the hub gene (lower). Each color represents a pathway marked in the upper right corner.

