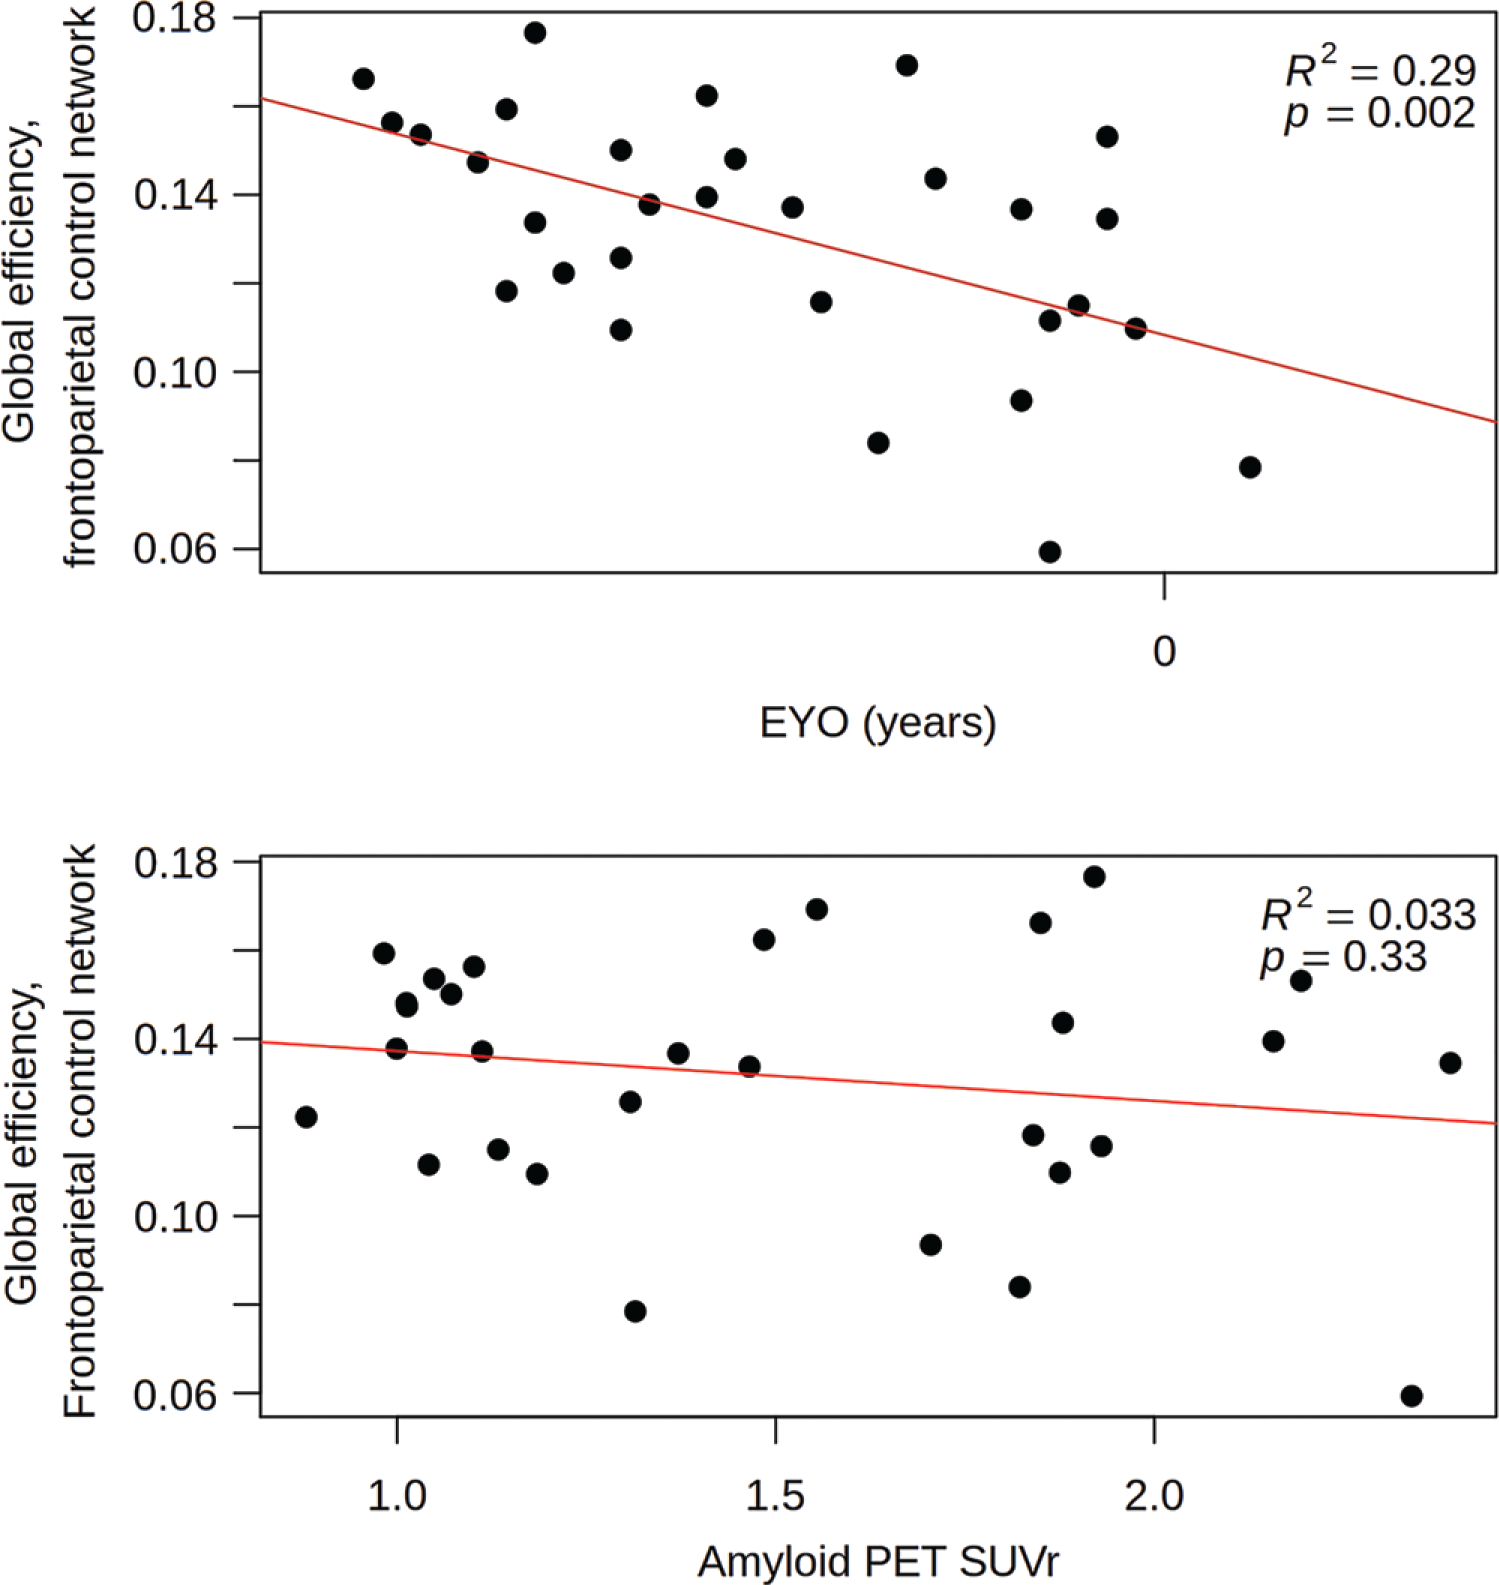
Figure 3:

Scatterplots show global efficiency in the frontoparietal control network versus estimated years to symptom onset (EYO) (top) and Pittsburgh compound B amyloid PET standardized uptake value ratio (SUVr) (bottom) in cognitively normal mutation-positive participants. The EYO axis in the top figure only has the 0 value plotted to protect against the unintended unblinding of mutation status for an individual at the extremes of the data, per Dominantly Inherited Alzheimer Network policy. The data in these plots, including R2 and P values, are not adjusted for multiple comparisons or for covariates that are in the statistical model defined in Equation (E2) (online).
