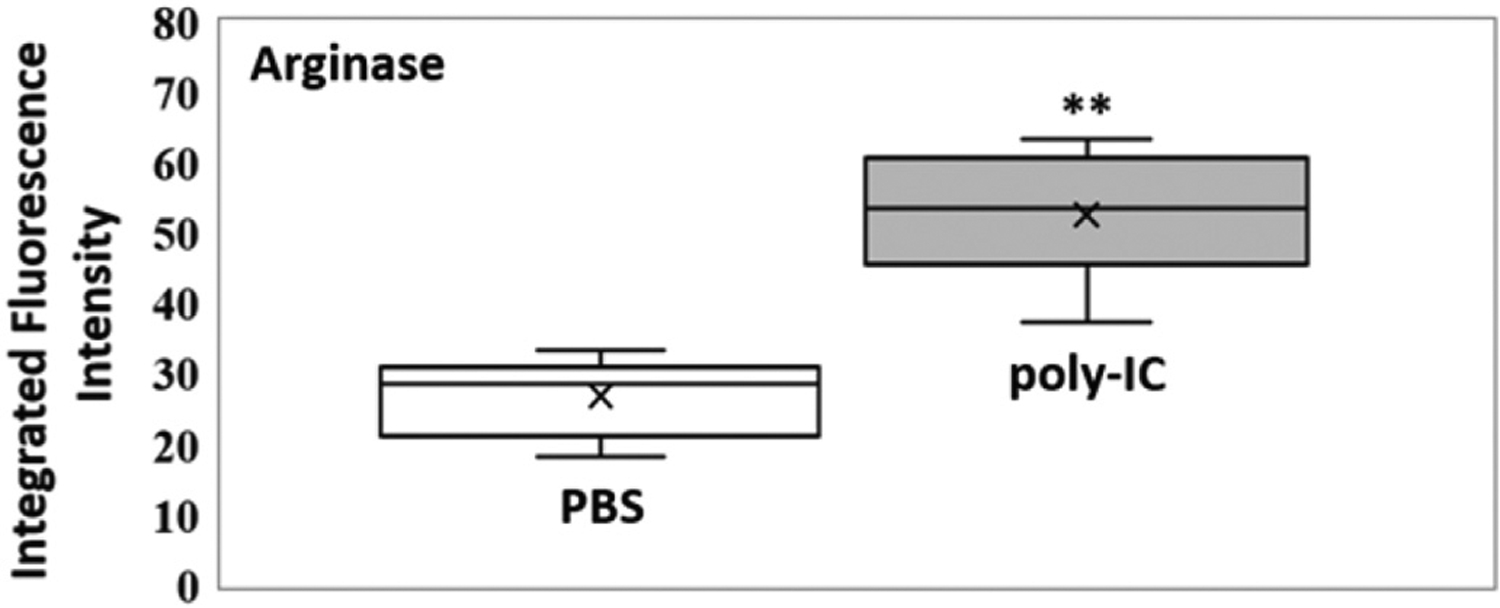
Figure 5.

Box plot (indicating the observed data range of integrated fluorescence intensity (BioTek Synergy H1) after 60 min of incubation at 300 K) for arginase activity in mouse bronchoalveolar lavage for PBS (white; n = 8) vs. poly-IC in PBS (gray; n = 8). For arginase the difference in nanobiosensor fluorescence observed in the group of mice treated with poly-IC vs. the group treated with PBS was statistically significant (**P < 0.01). The LODs (0.1 femtomoles) for arginase is 5.5 integrated fluorescence units.
