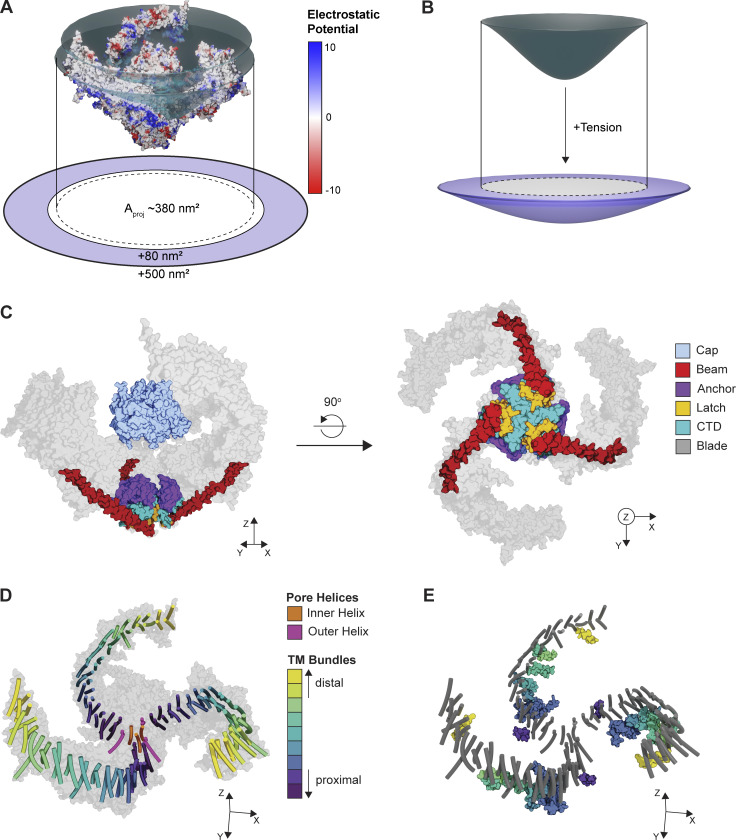
Figure 1.
Structure of Piezo ion channels. (A) Surface model of mouse Piezo2 (PDB accession no. 6KG7) colored according to electrostatic potential and embedded in a disc model of the putative membrane plane (dark teal). Red indicates a negative potential, and blue indicates a positive potential. The discs highlight the curvature of the uncharged region of the TMs. The projected area (Aproj) of the channel is shown as a dotted line. The putative range of area expansion upon flattening (80–500 nm) of the Piezo protein is shown in light purple. (B) Top: Side view of the membrane deformation in A (dark teal). Bottom: Schematized area expansion in the presence of tension with projected area of the relaxed membrane configuration overlaid (white + dotted line). (C) Left: Side view of a space-filling model of the Piezo2 cap, anchor, latch, beam, and C-terminal domain (CTD). Right: Bottom view of the same structures. A space-filling model of the blades is shown in light gray. (D) Transmembrane helix (TM) organization of the Piezo2 structure. TMs are colored according to bundle, which each containing four TMs. A space-filling model of the full protein is shown in light gray. (E) Same structure as in D, additionally showing interbundle amphipathic helices, colored according to the preceding bundle as in D. TMs are shown in dark gray.

