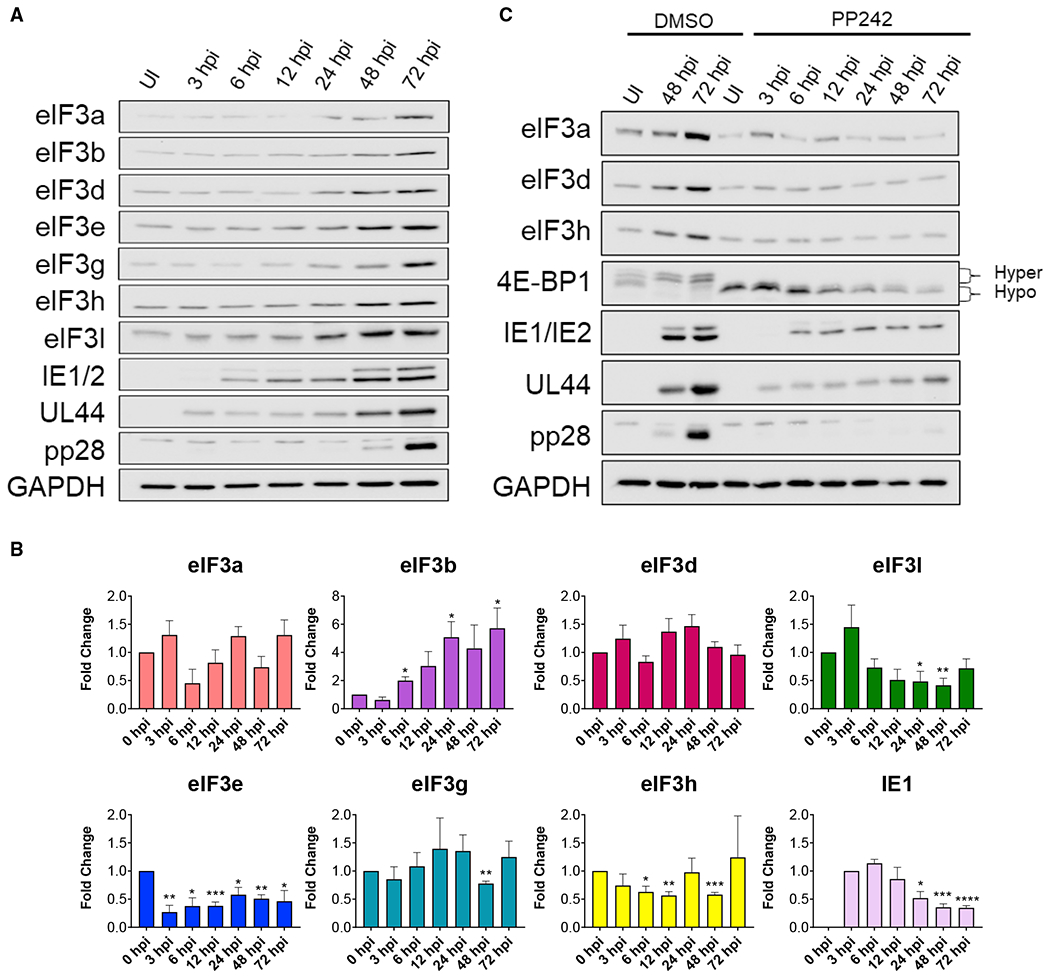
Figure 1. Regulation of eIF3 subunit accumulation in response to HCMV infection.

(A) NHDFs were mock (uninfected [UI]) or HCMV infected (AD169 strain; MOI = 3). At each indicated time post-infection total protein was collected, fractionated by SDS-PAGE, and analyzed by immunoblotting using the antibodies shown. GAPDH served as the loading control.
(B) As in (A) except total RNA was isolated at the indicated times. qRT-PCR analysis was performed for each indicated gene (n = 3). The HCMV IE1 gene provided a control for HCMV infection. IE1 RNA levels peaked around 6 hpi and then decreased as infection progressed as described (Stamminger et al., 1991; Stenberg and Stinski, 1985). n = 3 for each gene. Error bars indicate SEM. *p ≤ 0.05; **p ≤ 0.01; ***p ≤ 0.001; ****p ≤ 0.0001 by Student’s t test.
(C) As in (A) except cells were treated with DMSO or the mTOR active-site inhibitor, PP242 (added at 1.5 hpi; used at 2.5 μM). The change in 4E-BP1 migration from hyperphosphorylation (slow migrating) to hypophosphorylation (fast migrating) confirms PP242 activity.
