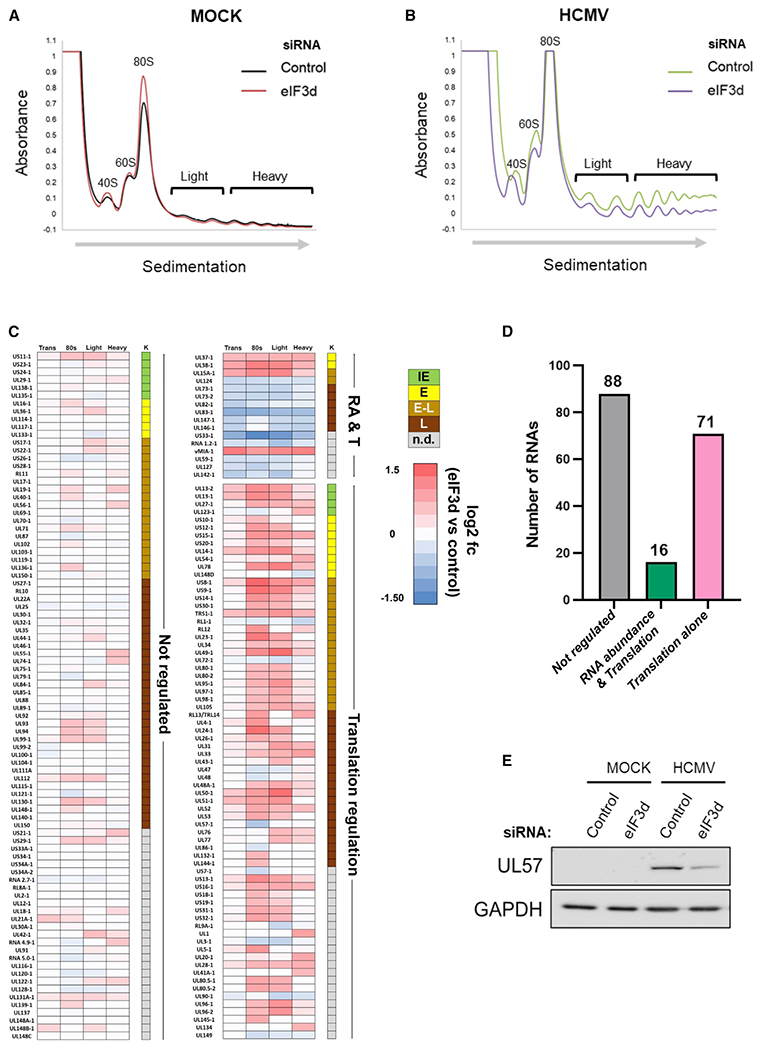
Figure 5. Regulation of polysome abundance and genome-wide HCMV mRNA translation by eIF3d.

(A and B) Absorbance tracing (A254nm) comparing sucrose gradient sedimentation profiles of cytoplasmic lysates from siRNA-treated (non-silencing control versus eIF3d-specific siRNA #2) mock-infected (A) or (B) HCMV-infected (TB40/E strain; MOI = 3) NHDFs harvested at 72 hpi. Migration of ribosome subunits (40S, 60S) 80S monosomes and polysomes (light, heavy) are shown. The top of the gradient is on the left, and the direction of sedimentation indicated by an arrow.
(C) RNA sequencing was performed on total RNA and RNA isolated from pooled sucrose gradient fractions representing 80S (monosome), light polyribosome (two to three ribosomes), and heavy polysome peaks (greater than or equal to four ribosomes) with three biological replicates per condition. The heatmap illustrates the response of individual HCMV genes in each pooled fraction to eIF3d depletion. HCMV genes are classified either as not regulated, regulated by RNA abundance and translation (RA and T), or translation alone. Each row represents a distinct HCMV RNA, while numbered columns represent log2fc differences in RNA abundance between eIF3d-depleted and control datasets with values for overall transcript levels (trans), 80S ribosome (one monosome), light polysomes (two to three ribosomes), and heavy polysomes (greater than or equal to four ribosomes). Each data point represents the log2fc difference in RNA abundance between eIF3d-depleted and control datasets. Colored boxes represent statistically significant differences (adjusted p value < 0.05) with positive values (red) indicating increased abundance in eIF3d-depleted samples and negative values (blue) indicating a decreased abundance. Temporal HCMV gene classification is shown (K) representing IE (green), E (yellow), early-late (E-L, tan), L (brown), or not determined (n.d., gray).
(D) Graph representing the number and classification of regulated HCMV RNA transcripts in each category.
(E) After 72h, total protein was isolated from mock- or HCMV-infected (TB40/E strain; MOI = 3) NHDFs treated with siRNA as indicated in (A), fractionated by SDS-PAGE, and analyzed by immunoblotting using the specified antibodies. GAPDH provides a loading control.
