Figure 3.
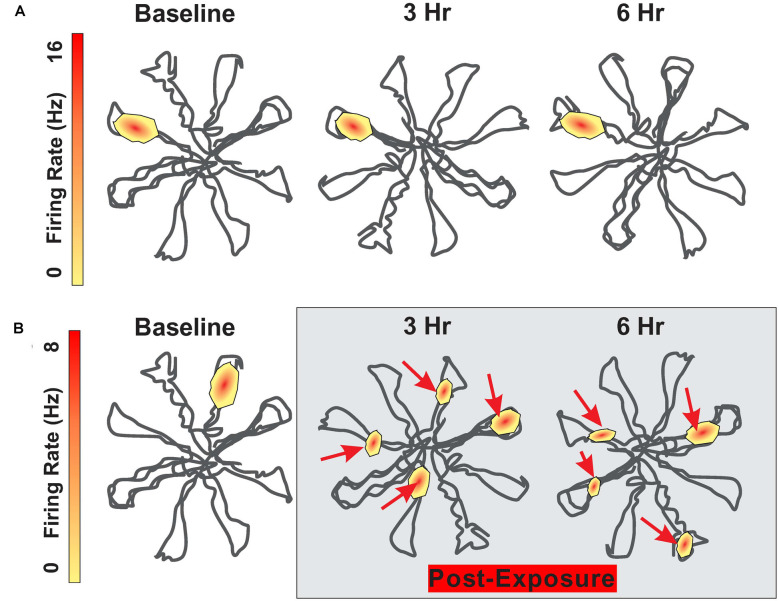
Schematic showing firing pattern of place cells in the hippocampus as rat navigates through an eight-arm radial maze. (A) Schematic showing place cell firing pattern within the radial maze; place at which the cell fires remain relatively stable between baseline and 3 h and 6 h later. (B) Schematic showing place cell firing pattern at baseline and then 3 h and 6 h following 30 min exposure to 104 dB SPL 4 kHz tone. Location of place cell firing locations drastically altered after the noise exposure. Maximum firing rate on upper and lower heat maps is 16 Hz and 8 Hz respectively.

