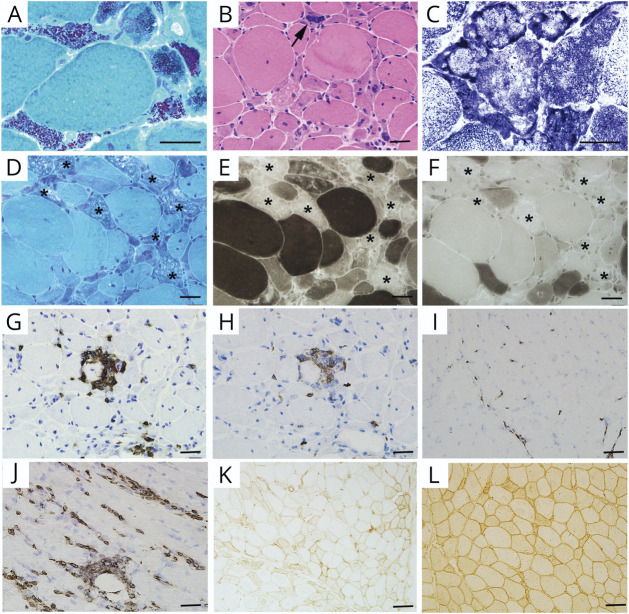
Figure 2. Routine Muscle Pathology.
(A) MGT staining showing typical reddish-purple granular rods accumulated in the atrophic fibers (P15). (B) HE staining demonstrating the angulated fibers with basophilic sarcoplasm, and pyknotic nuclei (arrow; P9). (C) Disorganized intermyofibrils presenting as lobulated or moth-eaten fibers (P15). (D–F) Atrophy of both type I and II fibers, and some rod-bearing fibers exhibiting loss of ATPase reactivity at both pH 10.4 (E) and 4.3 (F, asterisk; P8). (G and H) Focal endomysial CD3+ cells (G) and CD8+ cell (H) infiltrates in P13. (I and J) Scattered CD3+ cell infiltrates in P7 (I) and perivascular CD3+ cell infiltrates in P6 (J). (K and L) Focal MHC-I expression in P12 (K) and diffuse MHC-I expression in P7 (L). Scale bars: A–F, 10 μm; G–L, 50 μm. ATPase = adenosine triphosphatase; HE = hematoxylin and eosin; MGT = modified Gomori trichrome; MHC-I = Class I major histocompatibility complex.

