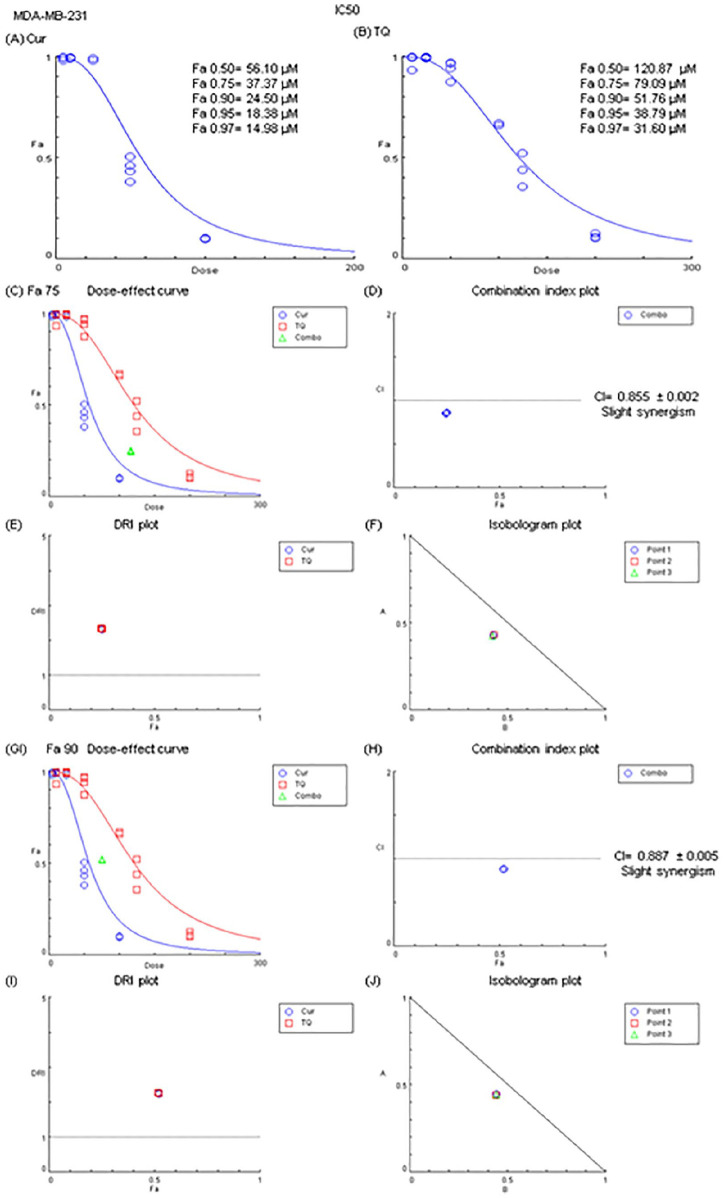
Figure 5.
Fa values and combination index of curcumin (Cur) and thymoquinone (TQ) against MDA-MB-231. (A) Fa values of Cur against MDA-MB-231. (B) Fa values of TQ against MDA-MB-231. (C) Dose-effect curve of Fa 75 of Cur (37.37 µM) and TQ (79.09 µM). (D) Combination index plot of Fa 75 of Cur and TQ. (E) DRI plot of Fa 75 of Cur and TQ. (F) Isobologram plot of Fa 75 of Cur and TQ. (G) Dose-effect curve of Fa 90 of Cur (24.50 µM) and TQ (51.76 µM). (H) Combination index plot of Fa 90 of Cur and TQ. (I) DRI plot of Fa 90 of Cur and TQ. (J) Isobologram plot of Fa 90 of Cur and TQ. The CI values represent the mean of 4 experiments. CI > 1.3: antagonism; CI (1.1-1.3): moderate antagonism; CI (0.9-1.1): additive effect; CI (0.8-0.9): slight synergism; CI (0.6-0.8): moderate synergism; CI (0.4-0.6): synergism; CI (0.2-0.4): strong synergism.

