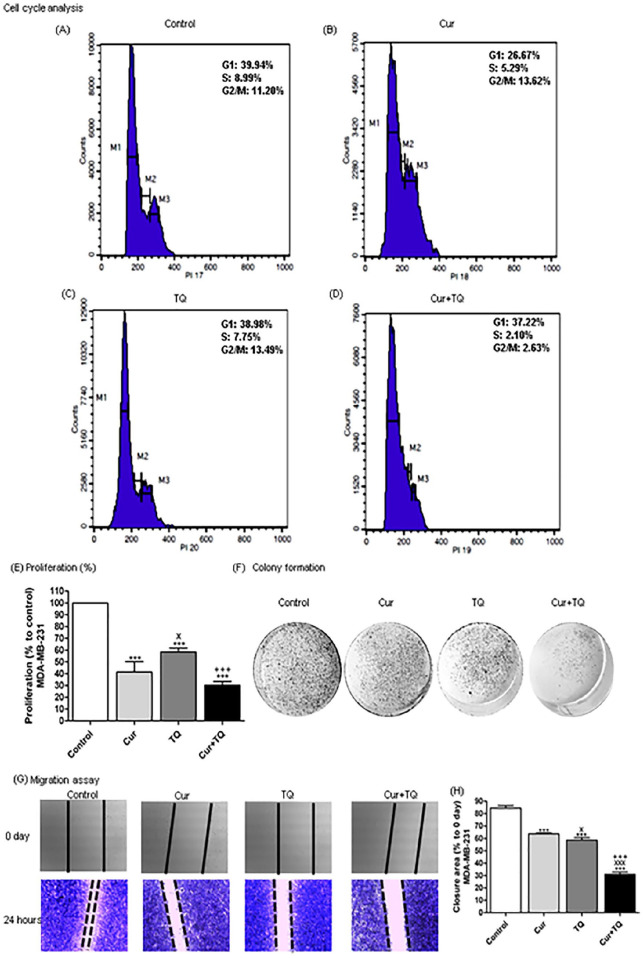
Figure 7.
Cell cycle analysis, proliferation percentage, colony formation, and migration assays of MDA-MB-231. Cell cycle analysis of MDA-MB-231 (A) control, (B) Cur (Fa 90 = 24.50 µM), (C) TQ (Fa 90 = 51.76 µM), and (D) their combination (Cur + TQ) groups. (E) Proliferation percentage of MDA-MB-231 control, Cur (Fa 90 = 24.50 µM), TQ (Fa 90 = 51.76 µM), and their combination (Cur + TQ) groups. (F) Colony formation assay of MDA-MB-231 control, Cur (Fa 90 = 24.50 µM), TQ (Fa 90 = 51.76 µM), and their combination (Cur + TQ) groups. (G, H) Migration assay of MDA-MB-231 control, Cur (Fa 90 = 24.50 µM), TQ (Fa 90 = 51.76 µM), and their combination (Cur + TQ) groups at 0 and 24 hours. The data were analyzed with one-way ANOVA followed by Tukey’s multiple comparison test. Error bars represent mean ± SD. ***P < .001 versus control. xP < .05 and xxxP < .001 versus Cur. +++P < .001 versus TQ.

