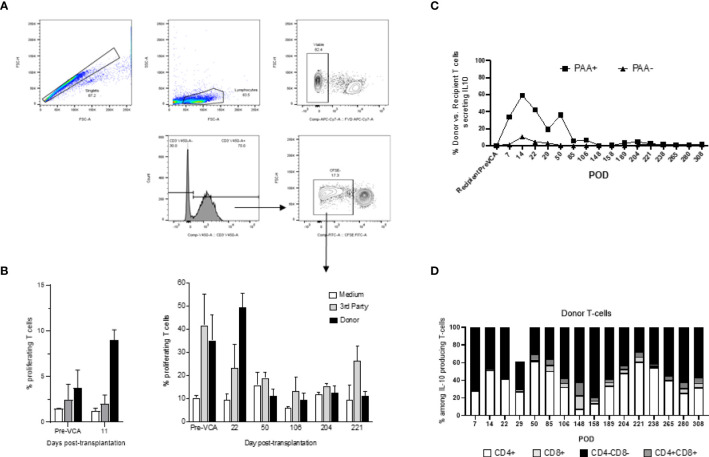
Figure 6.
(A) Gating strategy for mixed lymphocyte reaction (MLR) assay. Cells analyzed in this assay were first gated as singlet events, followed by gating on the major lymphocyte population. Fixable viability dye negative events (viable) were analyzed for CD3+ expression. This population was characterized based on CFSE fluorescence, where proliferating T-cells were denoted as CFSE dim and plotted as a proportion of total CD3+ events. (B) Mixed lymphocyte reaction assay testing proliferation of T cells in vitro (left panel untreated controls, right panel tolerant chimeric recipients). Untreated control animals demonstrate increased T-cell proliferation against donor targets at time of rejection (left panel), whereas tolerant animals have decreased T-cell responsiveness towards the donor overtime (right panel). From POD 50 onwards, which corresponds more or less to the withdrawal of all immunosuppression and establishment of multi-lineage mixed chimerism, cellular proliferation against donor and self-antigens were comparable to medium, suggesting a state of immune unresponsiveness in peripheral blood (right panel). (C) Similar to Figure 3 which showed equilibration of donor (PAA+) and recipient (PAA-) contribution to overall T cell populations, the contribution of IL-10 secreting T cells followed a similar pattern, approaching equilibrium at POD 85. Further analysis revealed that the majority of such IL-10 producing T cells are CD4-CD8- in nature (D). The results shown in panel (C, D) were obtained in one tolerant swine and are representative of all tolerant swine tested individually.

