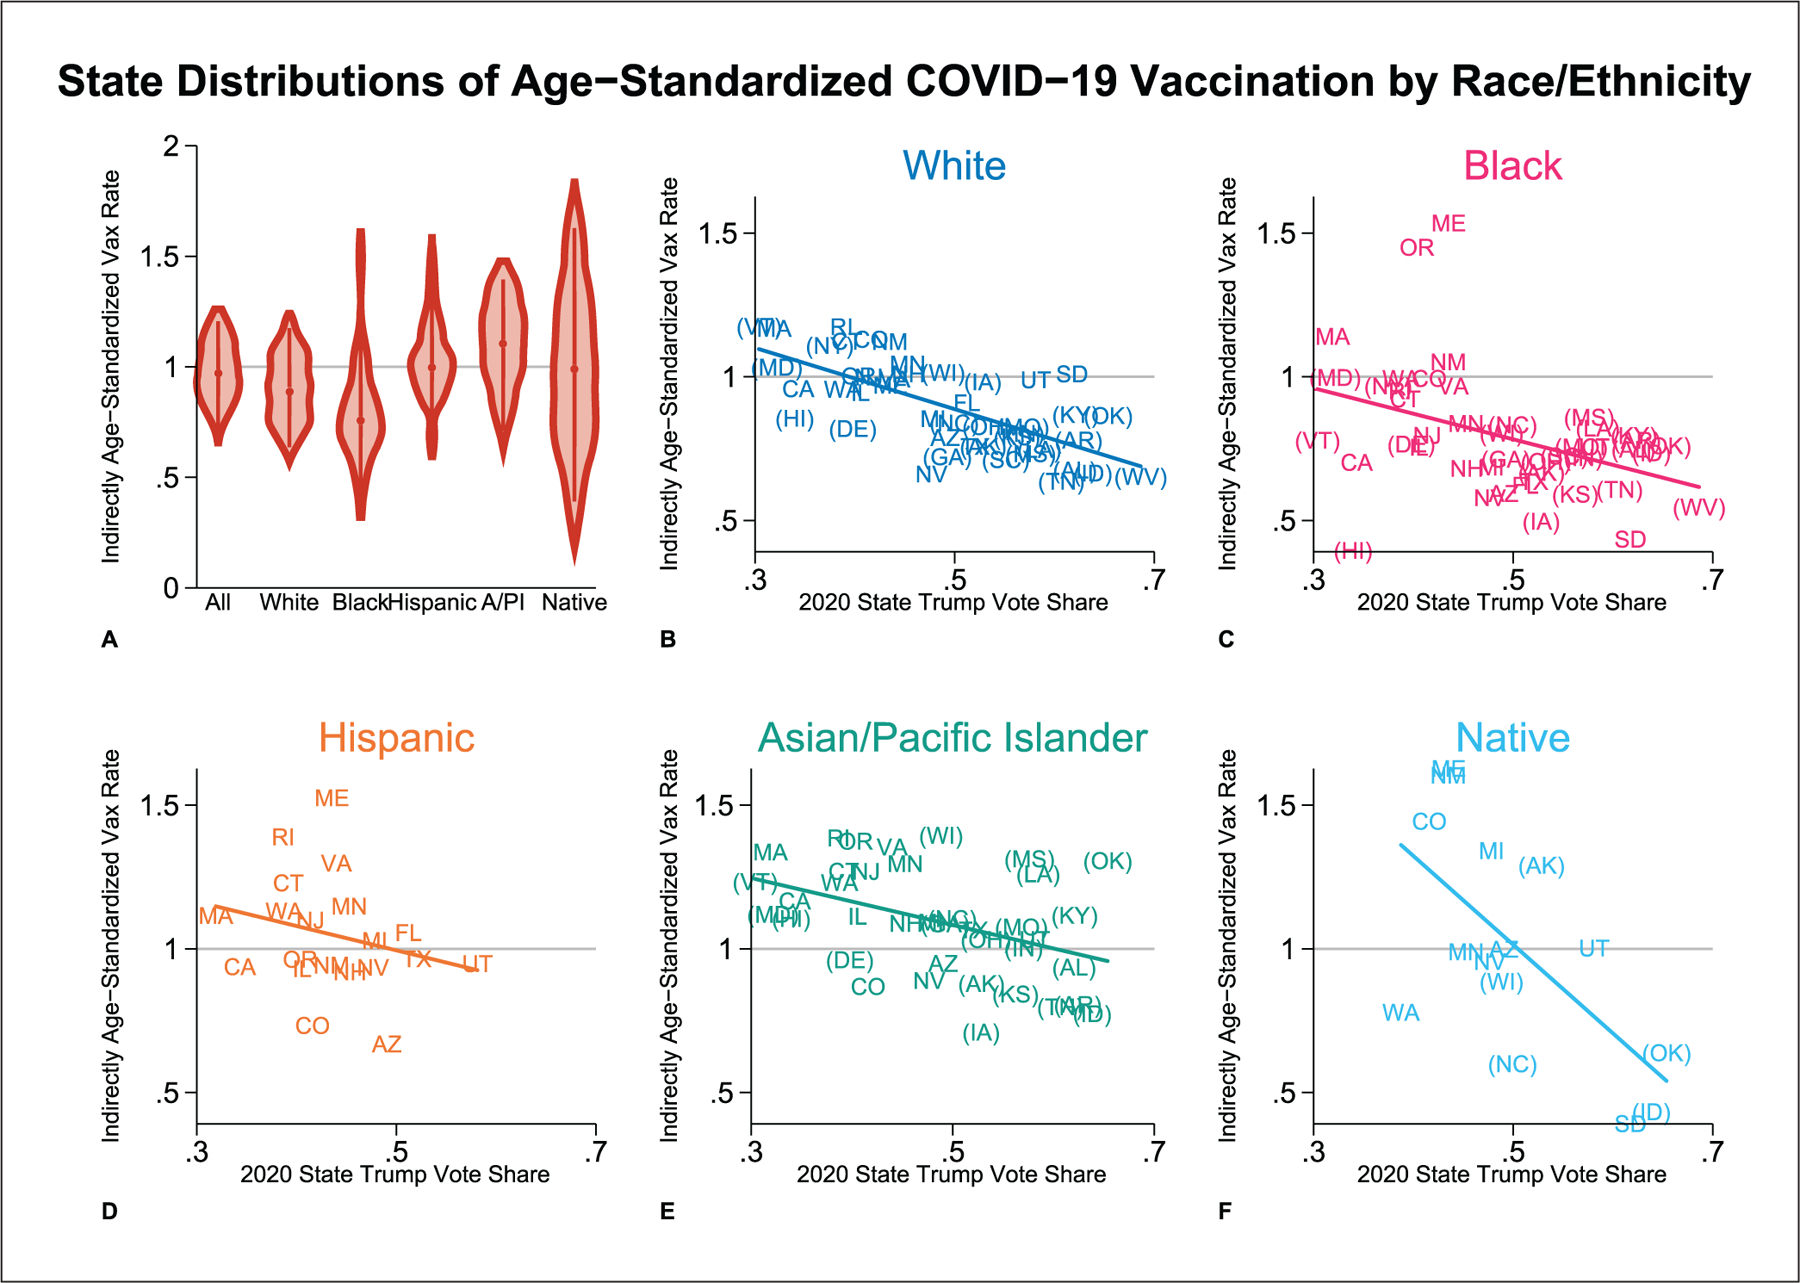
Figure 1.

Age-standardized vaccination by race/ethnicity and state (as of October 2021).
Note: Indirectly age-standardized vaccination rates are depicted by state and race/ethnicity. When these rates exceed 1, the population displayed has vaccination rates higher than would be expected on the basis of its age distribution; when the rates are less than 1, the population has vaccination rates lower than would be expected. Panel A presents a series of violin plots showing the distribution across states of age-standardized vaccination rates for each racial/ethnic group, smoothed using the Epanechnikov kernel. In this panel, the category labels stand for state aggregate, white, Black, Hispanic, Asian/Pacific Islander, and Native, respectively. Panels B to F show the state-specific, race/ethnicity-specific age-standardized vaccination rates as a function of states’ overall Trump vote share. States differ in their handling of Hispanic populations. Some exclude Hispanic individuals from other racial groups; others include Hispanic individuals in other racial groups. The latter states are labeled in panels B to F with parentheses surrounding their state abbreviations for racial groups other than Hispanic, indicating that those racial groups include Hispanic individuals. Population denominators match states’ reported handling of Hispanic individuals in vaccination data. State-specific, race/ethnicity-specific vaccination rates are based on vaccine share data from the Kaiser Family Foundation (October 18, 2021, data release) and state-level vaccination rates from the Centers for Disease Control and Prevention (October 21, 2021, data release). Age standardization is based on national age-specific vaccination rates from the Centers for Disease Control and Prevention (October 15, 2021, data download, reflecting vaccinations through October 6, 2021) and state-specific, race/ethnicity-specific population estimates from the National Center for Health Statistics.
