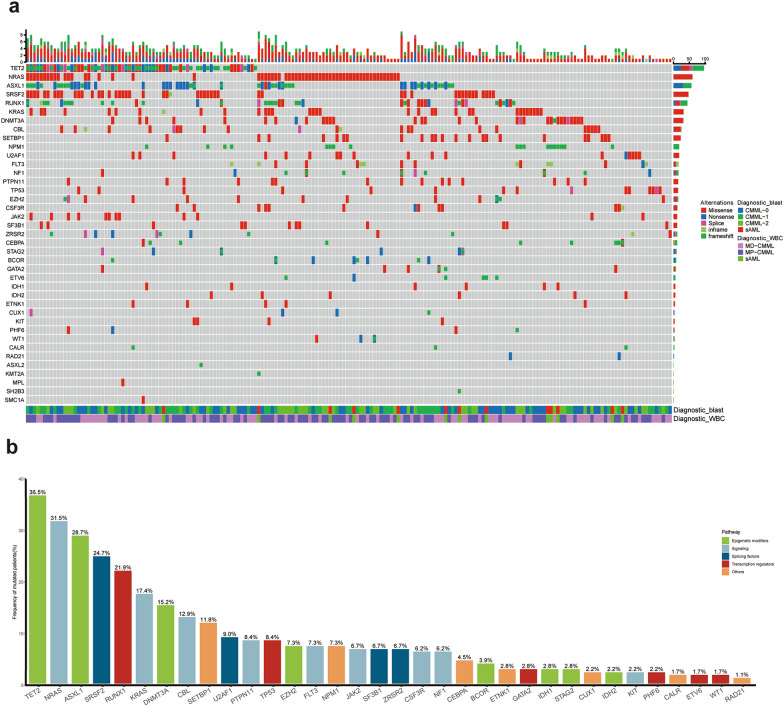
Fig. 1.
a The distribution of somatic mutations in CMML. Each column represents a patient and each row corresponds to a gene. The color of each rectangle represents the type of gene mutation, the diagnosis, and the karyotype of each patient. The bar graph indicates the mutation frequency, the mutation type, and the cytogenetics of each patient; b The overview of pathways involving in the identified mutations. The histogram represents the frequency of common gene mutations, and the mutation frequency is expressed as a percentage. FLT3 mutations consist of FLT3-ITD and FLT3-TKD

