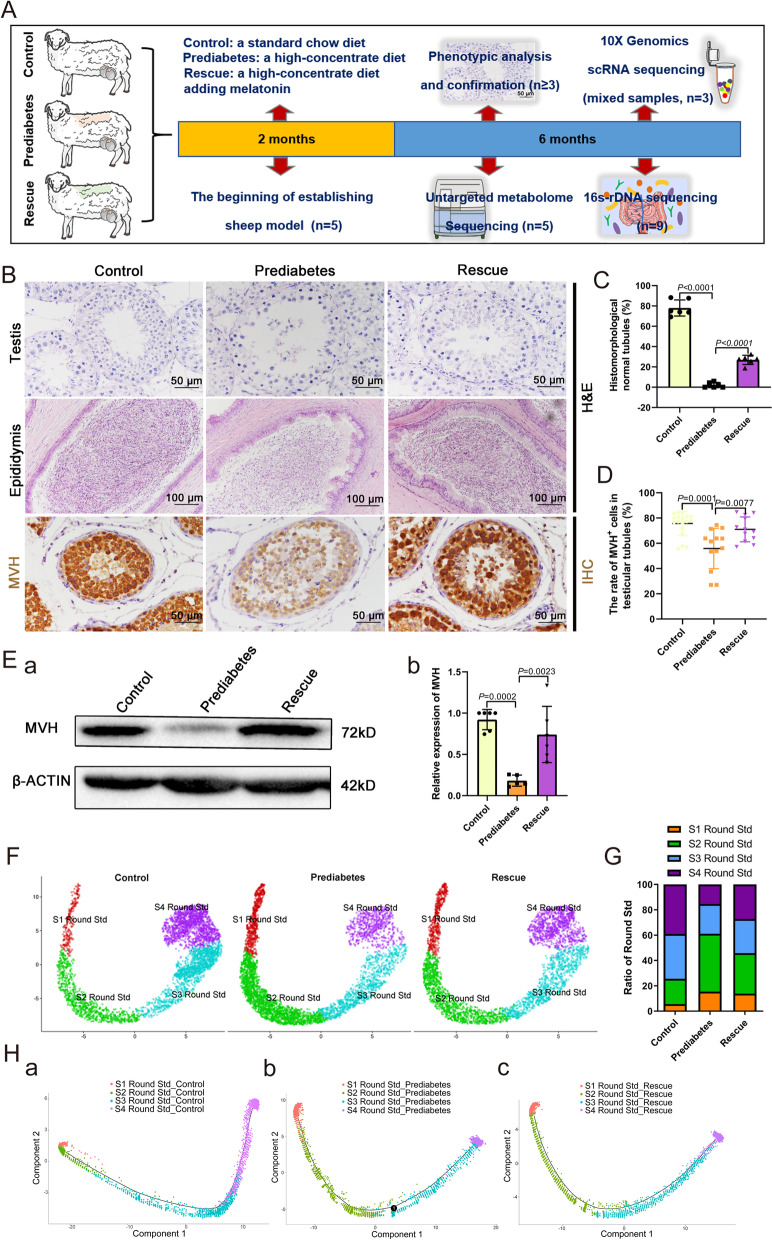
Fig. 1.
Disordered spermatogenesis in the prediabetic model. A The schematic to illustrate the experimental design. B Representative testicular and epididymal sections are stained with H&E and IHC for MVH. Scale bars = 100 μm and 50 μm. C The percentage of histomorphologically normal tubules in testicular samples from the three groups (n = 6). D The rate of MVH-positive cells in seminiferous tubules (n = 12). E (a) Western blot of MVH in the three groups. (b) Relative expression of MVH in each group (n = 6). F UMAP plot of round spermatids in testes, as defined by scRNA-seq analysis. G The percentage of four stages of round spermatids from the three groups. H (a-c) Single-cell trajectories of round spermatids in each group are shown with cells ordered in pseudotime. Branch point in the prediabetes group represents an arrest on transition from S2 to S3 Round Std

