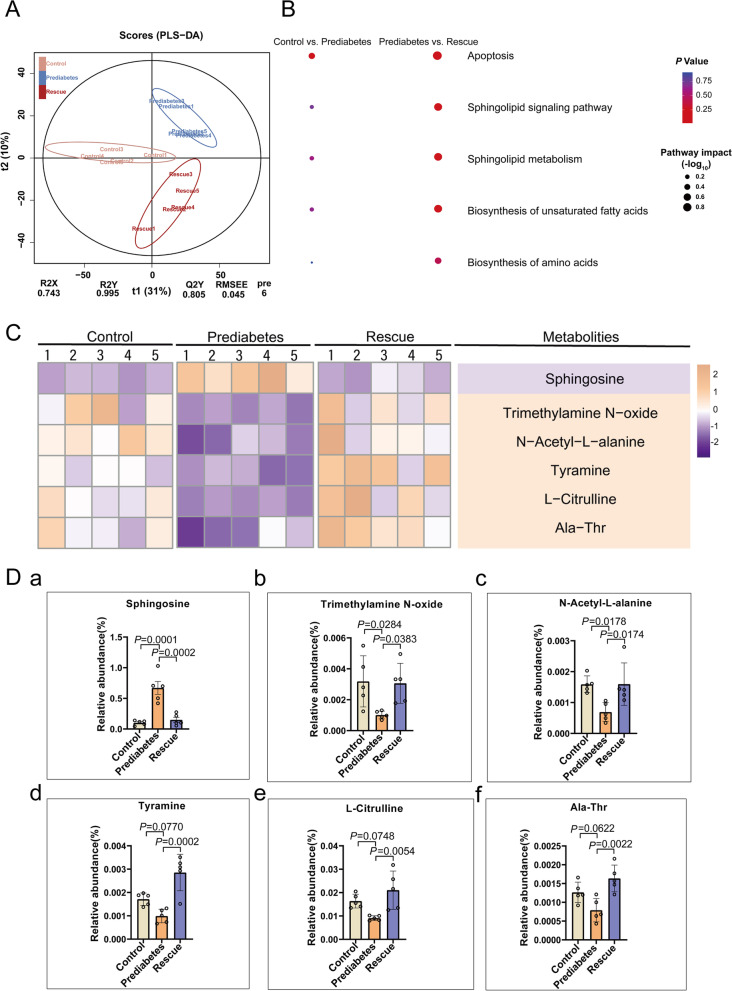
Fig. 2.
Abnormal metabolism of sphingosine in the prediabetic model. A PLS-DA score plot for discriminating the intestine digesta metabolome from the three groups. B Disturbed metabolic pathways in the control vs. prediabetes, and prediabetes vs. rescue groups. C Heatmaps of the differential metabolites that were altered in the prediabetes and rescue groups compared with the control group. D Comparison of the relative abundance of (a) sphingosine, (b) trimethylamine N-oxide, (c) N-acetyl-L-alanine, (d) tyramine, (e) L-citrulline, and (f) Ala-Thr in the three groups (n = 5)

