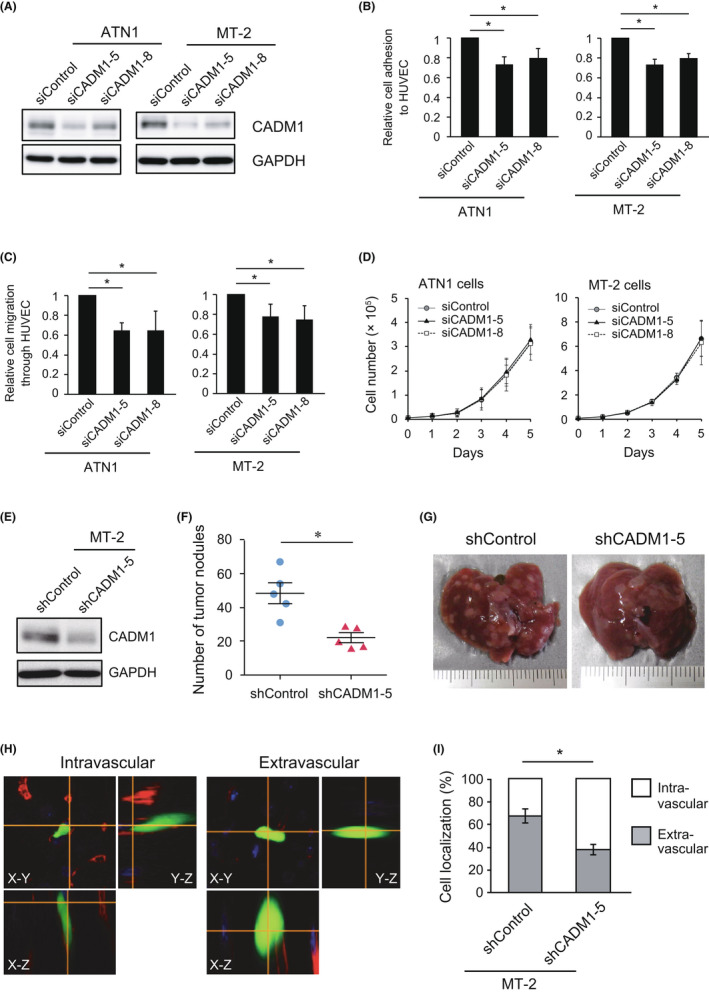
FIGURE 1.

Knockdown of CADM1 in ATL and HTLV‐I‐transformed T‐cell reduced adhesion to HUVEC and transendothelial migration. (A) CADM1 was knocked down in ATN1 and MT‐2 cells by electroporation of two individual siRNA. (B) HUVEC adhesion assay. ATN1 and MT‐2 cells were plated onto a HUVEC monolayer, and the number of attached cells was counted. Means ± SD of the relative number of attached cells in three independent experiments were shown. *p < 0.05 using Student's t test. (C) Transendothelial migration assay. ATN1 and MT‐2 cells were plated onto a HUVEC monolayer, which was cultured on transwell culture inserts coated with Matrigel. The number of migrated cells to the lower chamber filled with NIH3T3‐conditioned medium was counted. Means ± SD of the relative number of migrated cells in three independent experiments are shown. *p < 0.05 using Student's t test. (D) In vitro cell growth of ATN1 and MT‐2 cells treated with siCADM1. The cells were seeded in a 48‐well plate at 1 × 10⁴ cells/well, and the number of living cells was counted using a hemocytometer. Means ± SD of cell number in three independent experiments were shown. (E) CADM1 was stably knocked down in MT‐2 cells by introducing shRNA against CADM1. (F) The number of tumor nodules of MT‐2/shControl and MT‐2/shCADM1‐5 cells on the liver surface was counted. *p < 0.05 using Mann–Whitney U‐test. (G) Photographs of the livers 24 days after tail vein injection of MT‐2/shControl or MT‐2/shCADM1‐5 cells. (H) Representative images of MT‐2 cells in the liver. The blood vessels were stained using an anti‐CD31 antibody (red) to determine whether MT‐2 cells expressing EGFP were localized inside (intravascular, left) or outside blood vessels (extravascular, right) using confocal microscopy (magnification: ×600). (I) Percentage of intravascular and extravascular MT‐2 cells in the liver. Approximately 30 cells were analyzed in each sample. Means ± SD of three independent experiments were shown. *p < 0.05 using Student's t test
