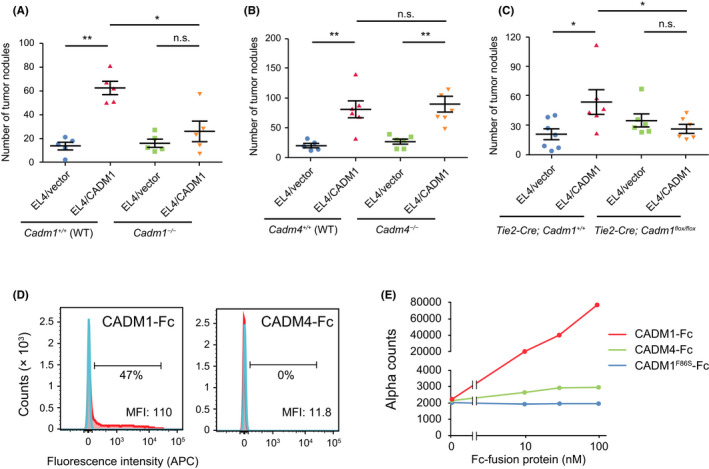
FIGURE 5.

Liver nodule formation of EL4 mouse T‐cell lymphoma cells in Cadm1‐ or Cadm4‐knockout mice. (A, B) The number of tumor nodules on the liver was counted after the tail vein injection of EL4/vector and EL4/CADM1 cells into Cadm1 −/− (A) or Cadm4 −/− mice (B) and their littermate wild‐type mice. *p < 0.05; **p < 0.01 using Mann–Whitney U‐test. (C) The number of tumor nodules on the liver was counted after the tail vein injection of EL4/vector and EL4/CADM1 cells into Cadm1 conditional knockout mice in vascular endothelial cells (Tie2‐Cre; Cadm1flox / flox ) and their littermate controls (Tie2‐Cre; Cadm1 +/+). *p < 0.05 using Mann–Whitney U‐test. (D) Flow cytometry‐based binding analysis of CADM1‐Fc or CADM4‐Fc to the cell‐surface CADM1. Histograms of cell counts treated with IgG (blue) or Fc‐fusion protein (red) are shown. The percentage of cell population bound to the Fc‐fusion protein was indicated. MFI: median fluorescence intensity. (E) The binding of FLAG‐tagged CADM1 with CADM1‐Fc or CADM4‐Fc was examined by Alpha technology. CADM1F86S‐Fc was used as a negative control
