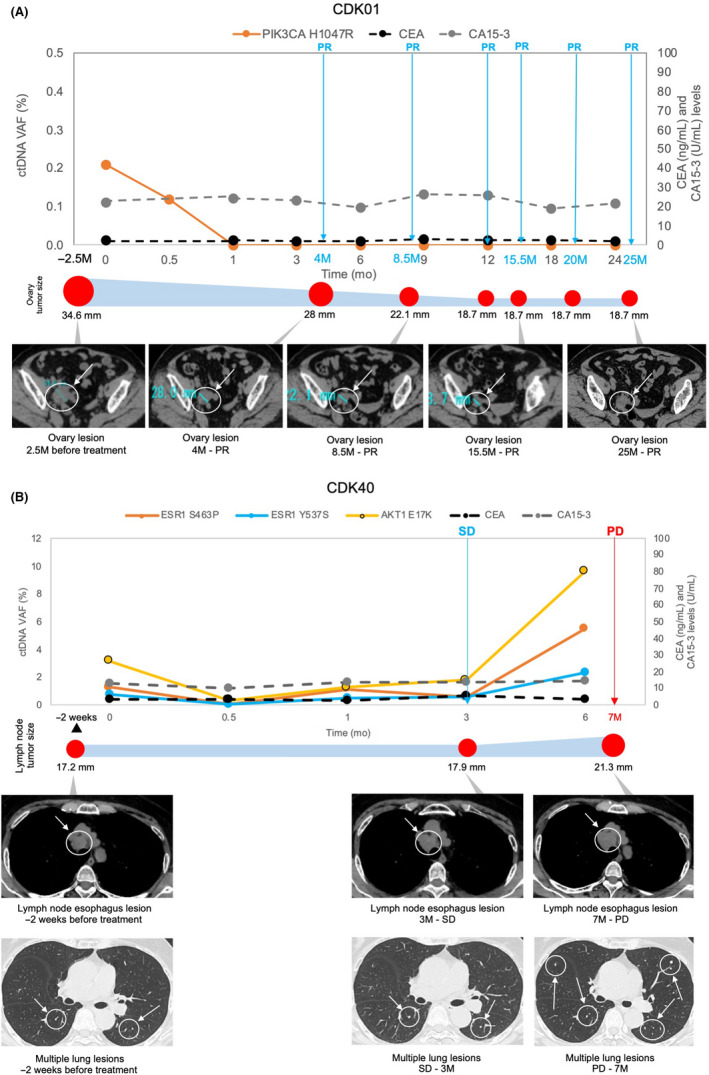
FIGURE 4.

Circulating tumor DNA (ctDNA) analysis and radiographic images of RECIST‐measurable disease. (A) CDK01, (B) CDK40 ctDNA levels compared with tumor size changes. Target lesion sizes are shown as graphical representations corresponding to the radiographic assessment intervals and are denoted with arrows on the radiographic images. CA 15‐3, cancer antigen 15‐3; CEA, carcinoembryonic antigen; PD, progressive disease; PR, partial response; SD, stable disease; VAF, variant allele frequency
