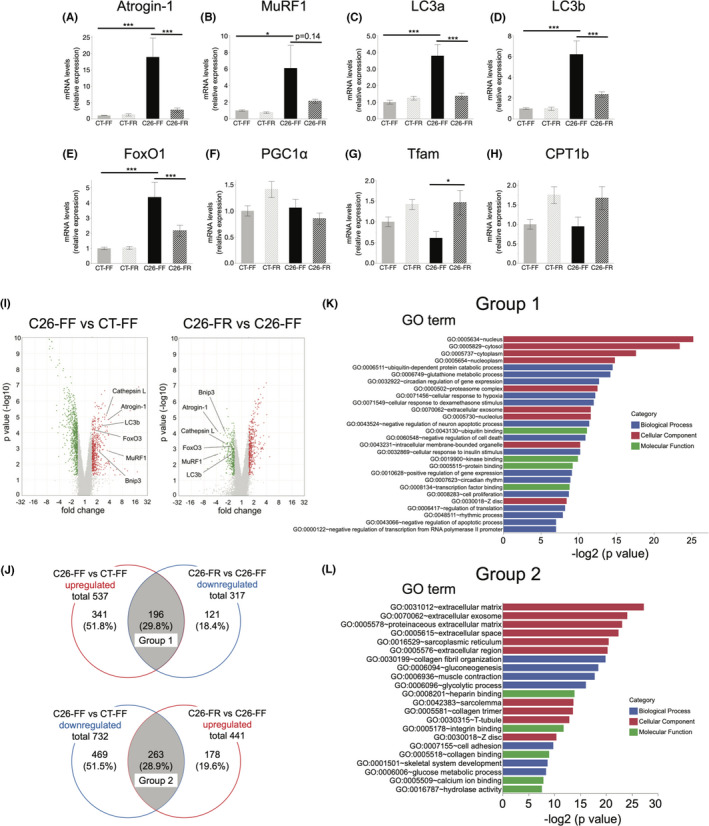
FIGURE 2.

Gene expression analysis of gastrocnemius muscle. RT‐PCR and microarray analysis were performed in mice on day 21. A, B, mRNA expression of the two muscle‐specific ubiquitin ligases. C‐E, mRNA expression of the representative autophagy markers and FoxO1. F‐H, mRNA expression of the representative mitochondrial markers. I, Volcano plots from microarray analysis comparing the C26‐FF versus CT‐FF groups (left) and the C26‐FR versus C26‐FF groups (right). Red and green plots indicate genes that were up‐ and downregulated, respectively. J, Venn diagrams showing the number of differentially expressed genes in the C26‐FF versus CT‐FF groups and the C26‐FR versus C26‐FF groups, and the number of genes which overlap between them (defined as groups 1 and 2, respectively). K, L, Gene ontology analysis showing the enriched terms of groups 1 and 2. A‐H are shown as means ± SEM (n = 7, 8 per group). Microarray data (I‐K) consist of n = 3 per group. *p < 0.05, **p < 0.01, ***p < 0.001. FF, fiber‐free; FR, fiber‐rich
