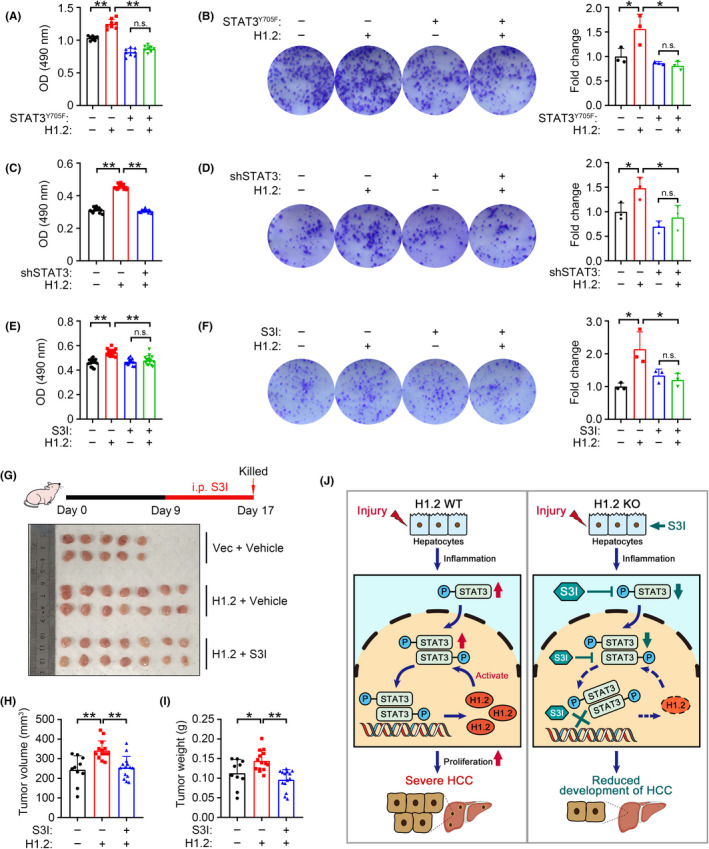
FIGURE 7.

Tumor‐promoting effect of histone H1.2 depends on signal transducer and activator of transcription 3 (STAT3) activity. (A, B) MTT assay (A, n = 15) and representative images with quantification results (B, n = 3) of colony formation in LM3 cells transfected with or without H1.2 and STAT3Y705F. (C, D) MTT assay (C, n = 15) and representative images with quantification (D, n = 3) of colony formation in LM3 cells transfected with or without H1.2 and shSTAT3. (E, F) MTT assay (E, n = 15) and representative images with quantification results (F, n = 3) of colony formation in H1.2‐overexpressing LM3 cells under S3I‐201 (S3I) treatment. (G) Experimental design flowchart (top panel) and dissected xenograft tumors (bottom panel). (H, I) Tumor volume (H) and weight (I) of xenograft tumors from indicated groups. (J) A proposed model for the role of H1.2/STAT3 loop in regulating hepatocellular carcinoma (HCC). Results expressed as mean ± SD from three independent experiments. *p < 0.05, **p < 0.01. KO, knockout; n.s., not significant; OD, optical density; Vec, vector
