FIGURE 2.

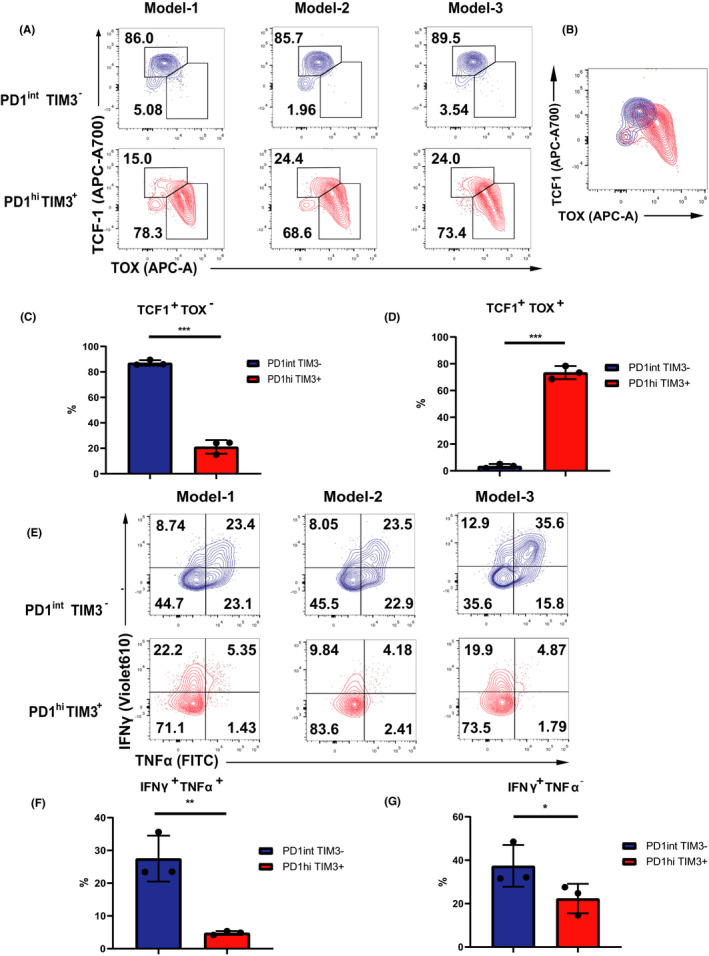
TOX and TCF1 control T ex differentiation status. (A) Representative flow plots of TOX and TCF1 ratio in PD1int TIM3‐ and PD1hi TIM3+ cells (n = 3 per group). (B) The overlap of TOX and TCF1 expression in TCF1+PD‐1int subset. (C, D) Statistical chart of A (n = 3 per group). (E) Representative flow plots and frequency of IFNγ and TNFα expression among CD8+ TILs after Stimulation 6h with CD3/CD28 Ab in PD1int TIM3‐ and PD1hi TIM3+ cells (n = 3 per group). (F–G) Statistical chart of E (n = 3 per group). Statistical significance was assessed by Student’s t test (C–D; F–G). (not significant [ns], p > 0.05, *p < 0.05, **p < 0.01)
